ANOVA (Analysis of Variance)
The ANOVA test is a statistical test that can be done in place of multiple T-tests when comparing the means of more than two groups at a time.
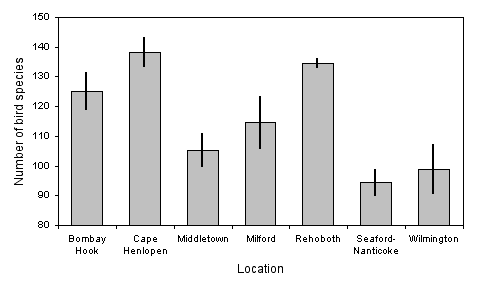
The ANOVA test would be used to determine if there is a significant difference in the mean number of bird species in the seven locations.
|
The ANOVA is a single test to determine the significance of the difference between the means of three or more groups.
|
The t-test tells us if the variation between two groups is "significant". If you have 5 five levels of a manipulated variable in an experiment, you would need to compare the mean of each level of the MV to the mean of each other level of the MV. That’s 10 T-tests! Not only would 10 T-tests be a pain to calculate, but multiple t-tests are not the answer because with each T-test, the likelihood of drawing an incorrect conclusion increases. If we did 10 t-tests, we should not be surprised to observe things that happen only 5% of the time (p=0.05).
The ANOVA statistic prevents us from having to do multiple t-tests and puts all the data into one number. The math required of the ANOVA test is beyond the scope of this class. There are excellent on-line ANOVA calculators that will do the math and draw a conclusion for you. In nearly every situation in IB biology, if given a choice, you will want to select "one way ANOVA" (what this actually means is beyond our scope, but I can explain it to you if you are actually curious).
Just like the T-test, the ANOVA tests the null and alternative hypothesis:
|
Null Hypothesis:
"There is not a significant difference between the groups; any observed differences may be due to chance and sampling error." For example:
|
Alternative Hypothesis:
"There is a significant difference between the groups; the observed differences are most likely not due to chance or sampling error." For example:
|
Performing an ANOVA
ANOVA calculators such as this one will return a p-value. A p-value of less than 0.05 means that the null hypothesis is rejected (that there is a significant difference among your groups). However, you do not know which group or groups are causing this to be true. If there is at least one significant difference among the groups, then the p-value will be <0.05.
Therefore, if the p-value of the ANOVA test is significant, it can be followed by a Tukey's post hoc test to examine differences between each possible pair of groups. The Post-hoc tests to compares each group to each other group to see if there is a significant difference between then. A p-value will be provided for each possible pairwise comparison between experimental groups.
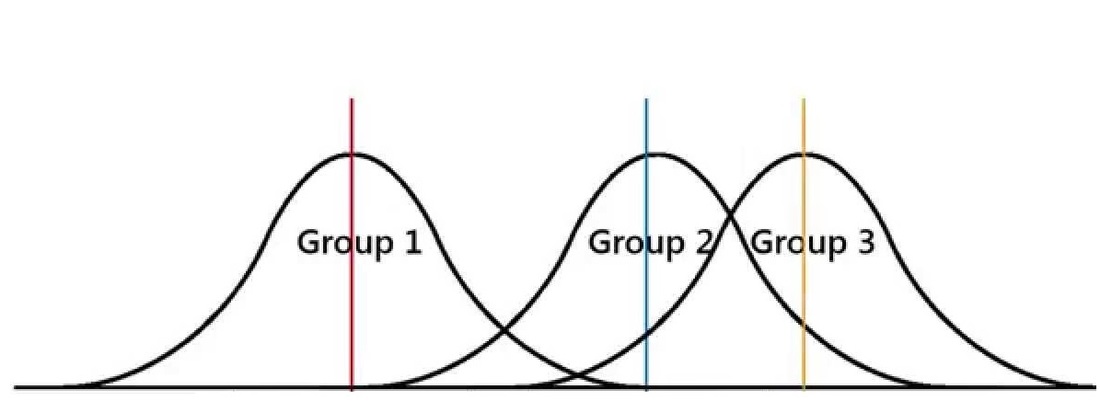
The Tukey's pairwise comparisons are displayed as letters on the column graph: If two groups share a letter, it means they are not significantly different from each other. See an example of a figure displaying ANOVA and Tukey's post hoc comparisons below:
Therefore, if the p-value of the ANOVA test is significant, it can be followed by a Tukey's post hoc test to examine differences between each possible pair of groups. The Post-hoc tests to compares each group to each other group to see if there is a significant difference between then. A p-value will be provided for each possible pairwise comparison between experimental groups.
The Tukey's pairwise comparisons are displayed as letters on the column graph: If two groups share a letter, it means they are not significantly different from each other. See an example of a figure displaying ANOVA and Tukey's post hoc comparisons below:
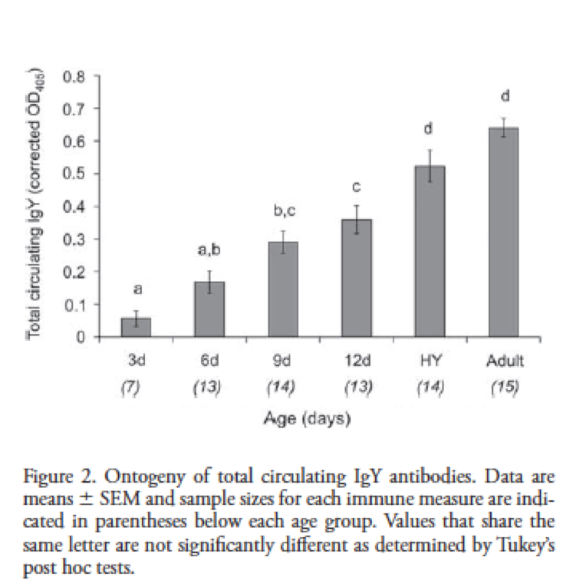
This experiment examined the development of the immune system in house sparrows. Researchers took blood samples and measured the level of antibodies circulating in the blood. Birds were sampled at a range of ages from 3 days after hatching through adulthood. (Killpack, Oguchi, & Karasov, 2013).
The ANOVA test was significant, which told the researchers that at least one pair of age groups differed. A Tukey's test was run to learn which pair(s) significantly differed. Examine the letters above the bars in the figure. Which age groups significantly differed in antibody levels?
Performing an ANOVA test with Google Sheets
In order to run an ANOVA in Google Sheets, you have to install a statistics add-on. Here's a good video explaining how to do it! The "groups" would be the different levels of your manipulated variable. If the p value is greater than 0.05, then the results are not-significant (there is no significant different between the means of the groups).
Performing an ANOVA test with the TI-83/84

- Hit the STAT button on the calculator
- Select option 4 to clear any past lists of data.
- Select option 1 to EDIT your lists.
- Enter your data for each group as Lists. The data for each level of the MV should be placed in its own list.
- Hit STAT button and use the arrow key to move over to the TESTS option
- Scroll down to option H, the ANOVA and hit ENTER
- Enter the lists you want to include in the ANOVA
- Your results are given. The ANOVA test will result in
a “p-value.” If the p-value you get is less than 0.05, we reject the null hypothesis and conclude that there
is a significant difference between the means being compared. Likewise, if the p-value you get is more than
0.05, you would accept the null hypothesis and conclude that there is no significance difference between the means.