Graphing with Excel 2016
Scroll down the page to get directions for creating pie charts, bar graphs, histograms, line graphs and scatter plots in Excel.
If you prefer to graph in Google Sheets, here's a tip sheet, including how to add custom error bars to your graphs!
If you prefer to graph in Google Sheets, here's a tip sheet, including how to add custom error bars to your graphs!
Pie Chart
In your spreadsheet, select the data to use for your pie chart. Click Insert > Insert Pie or Doughnut Chart, and then pick the specific chart you want. Click the chart and then click the icons next to the chart to add a title and adjust labels.
|

|
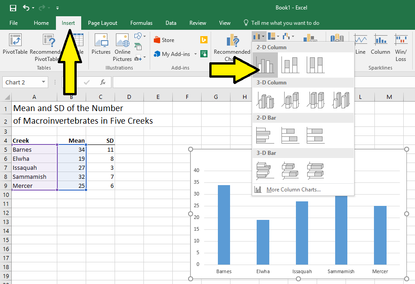
Bar Graph
In your spreadsheet, select the data to use for your bar chart (typically this is the mean of a data set). Click Insert > Insert 2-D Column. Click the chart and then click the icons next to the chart to add axis labels and a title.
|

|
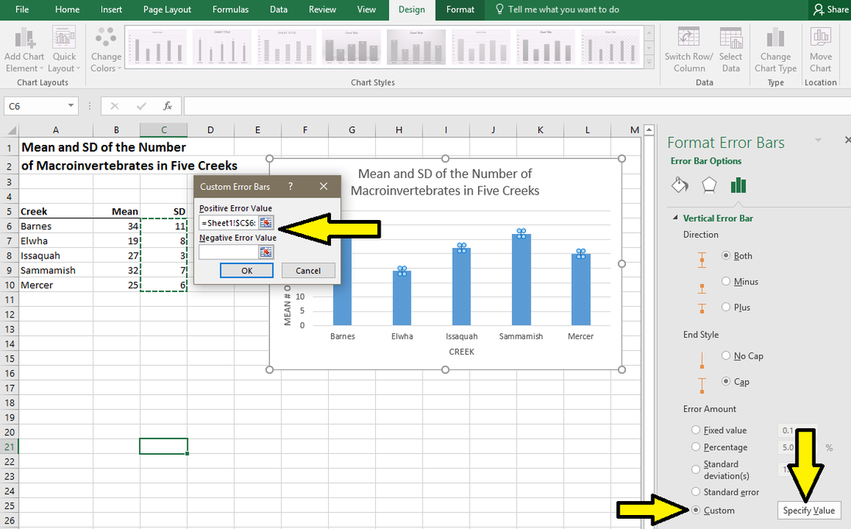
Next you need to add the standard deviations lines for each bar. Click on the chart and then Add Chart Element. Select Error Bars from the drop down menu and then "More Error Bars Options." This is counter intuitive when there is an option called "standard deviation" directly above. But, DON'T pick standard deviation here! If you do, then Excel will calculate the standard deviation of the means collectively, not graph each means SD individually. Big no-no.
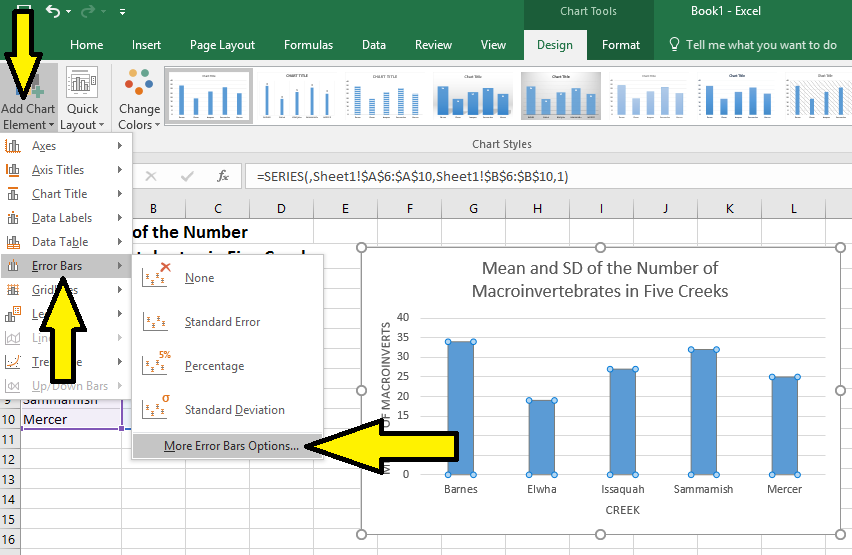
A side bar will open with options. You want to select both directions, cap, custom and specify value. A pop up box will appear. Delete what is in the Positive Error Value box and then select the standard deviations for your means. Select all the standard deviations together. Hit OK and then repeat for the Negative Error Value. You will be selecting the same SD values for both the positive and negative values. You will know if you've done it correctly when you have bars on your graph that are equal distance above and below the mean value and unique for each level of the manipulated variable on your X-axis.
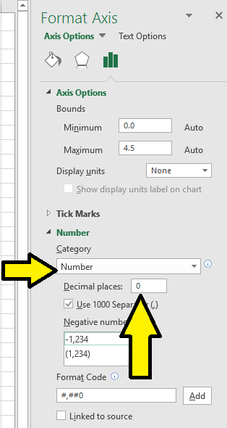
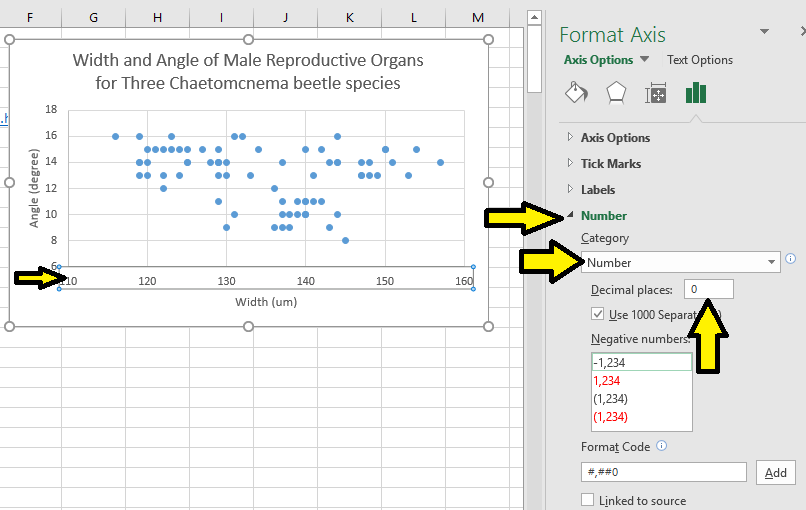
One item that often needs to be adjusted on graphs made by Excel is the consistency in precision of the values on the X and/or Y axis. Like your data, the values on the X and Y axis should have a consistent and correct number of digits. Excel will not default to the correct number. In order to change these values, right click on the axis label values and select Format Axis. A side menu will appear. Click by the Number heading. Change the category for Number and indicate the number of decimal places you would like the labels to have.
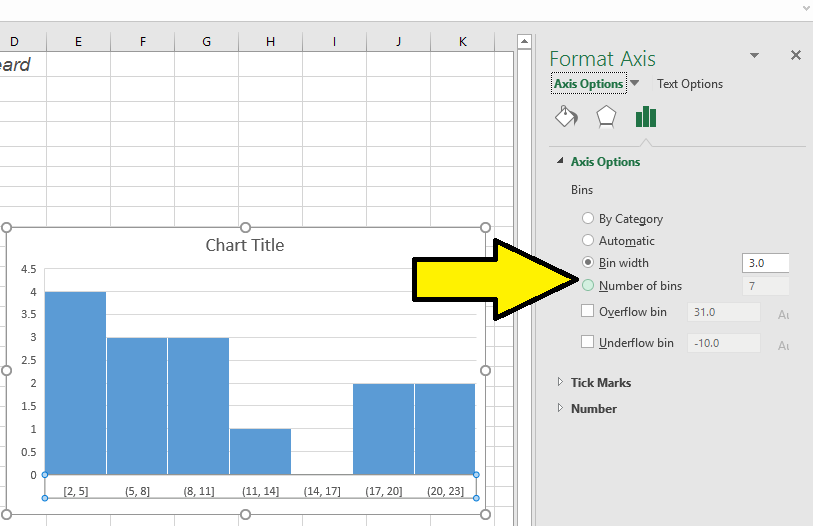
Histogram
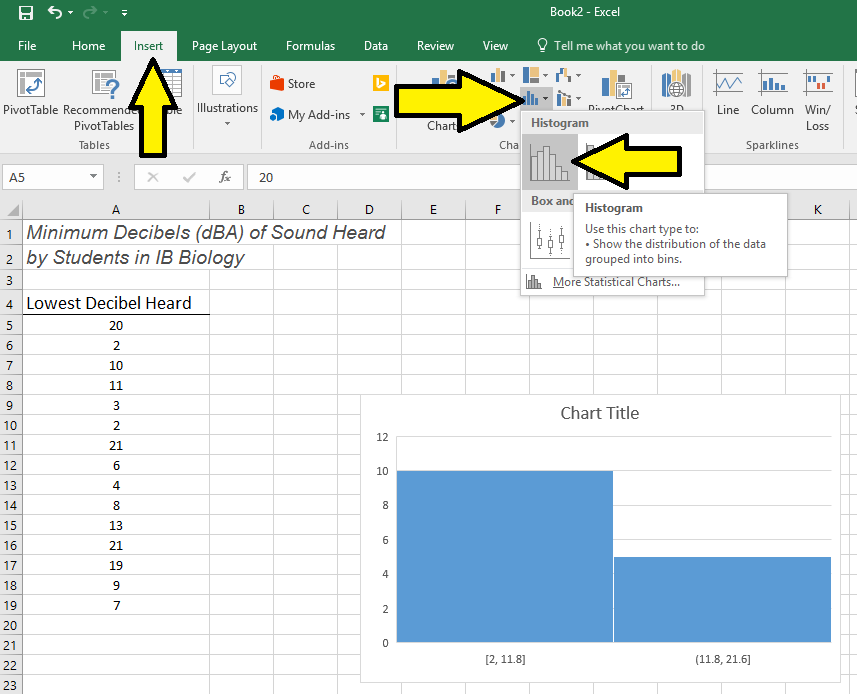
Select your data and click insert > Insert Statistic Chart > Histogram.
To adjust the spacing of the histogram bins (the amount of data grouped along the X-axis), right click on the horizontal axis on the chart, click Format Axis and then Axis Options.
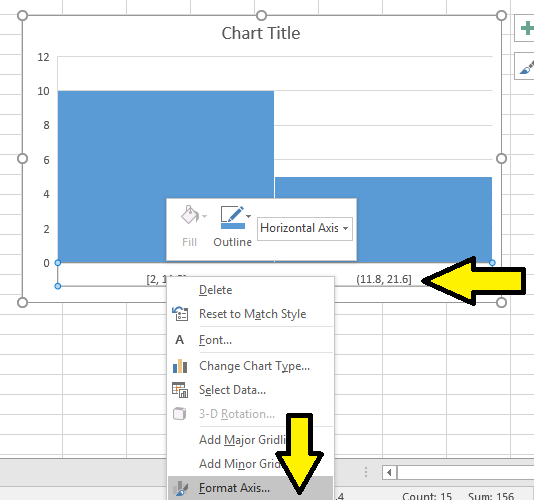
On the side bar, you can adjust the x-axis groupings by changing either the "bin width" or the "number of bins."
As above in the directions for a Bar Graph, finalize formatting of the histogram (i.e. adding a title and labeling axis) by selecting Add Chart Element from the Design tab. Also, if needed, adjust the values on the X and Y axis to ensure consistency and correctness in the number of digits being displayed.
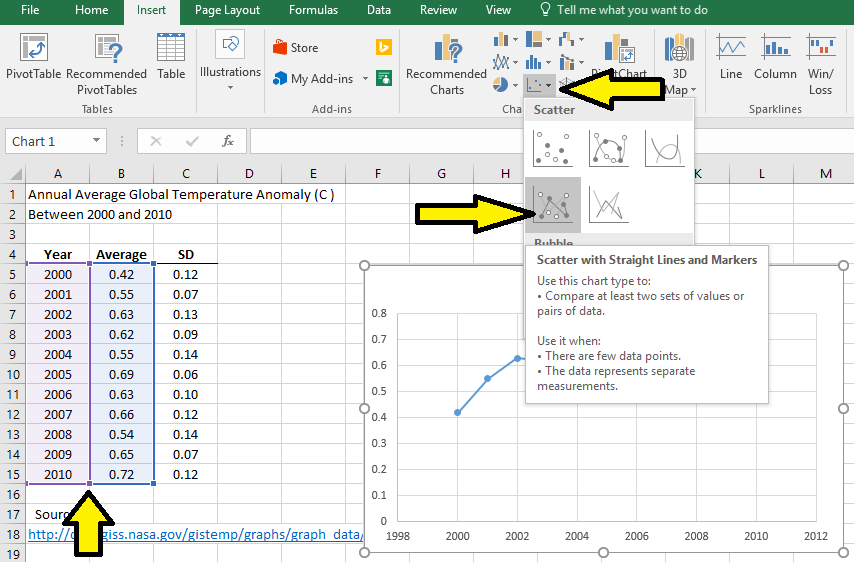
Line Graph
Be sure you have your data in columns, with the X-axis variable to the left of the Y-axis variable data. Select your data and click insert > Insert Scatter > Scatter with Straight Lines and Markers.
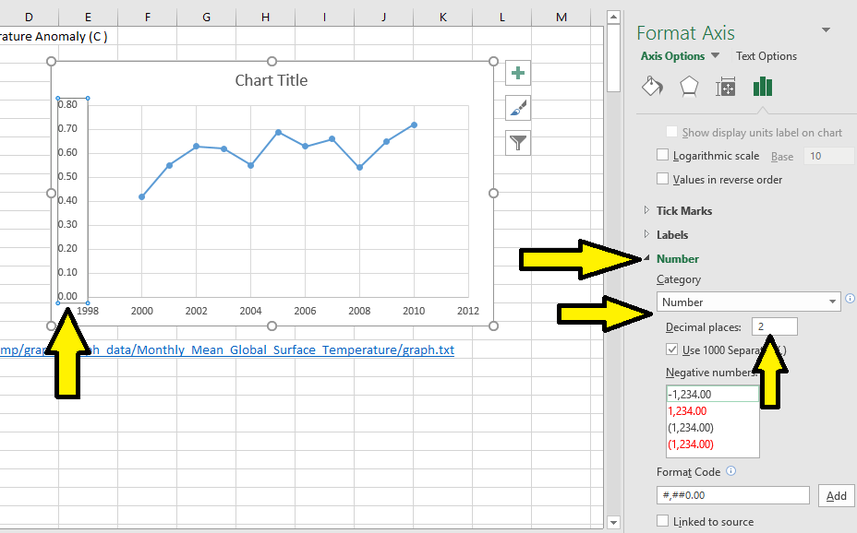
Click the graph, and on the design tab select Add Chart Element to include a graph title and axis labels. Often you'll need to adjust the values on the axis so they include the a correct and consistent number of digits. Right click on the axis values, and from the side menu select number. In the box, indicate you want a number and then how many digits you want to include after the decimal place.
As with a bar graph, you often need to add the SD error bars to a line graph. Click on the chart and then Add Chart Element. Select Error Bars from the drop down menu and then "More Error Bars Options." This is counter intuitive when there is an option called "standard deviation" directly above. But, DON'T pick standard deviation here! If you do, then Excel will calculate the standard deviation of the means collectively, not graph each means SD individually. Big no-no.
A side bar will open with options. You want to select both directions, cap, custom and specify value. A pop up box will appear. Delete what is in the Positive Error Value box and then select the standard deviations for the data points. Select all the standard deviations together. Hit OK and then repeat for the Negative Error Value. You will be selecting the same SD values for both the positive and negative values. You will know if you've done it correctly when you have bars on your graph that are equal distance above and below the mean value and unique for each level of the manipulated variable on your X-axis.
A side bar will open with options. You want to select both directions, cap, custom and specify value. A pop up box will appear. Delete what is in the Positive Error Value box and then select the standard deviations for the data points. Select all the standard deviations together. Hit OK and then repeat for the Negative Error Value. You will be selecting the same SD values for both the positive and negative values. You will know if you've done it correctly when you have bars on your graph that are equal distance above and below the mean value and unique for each level of the manipulated variable on your X-axis.
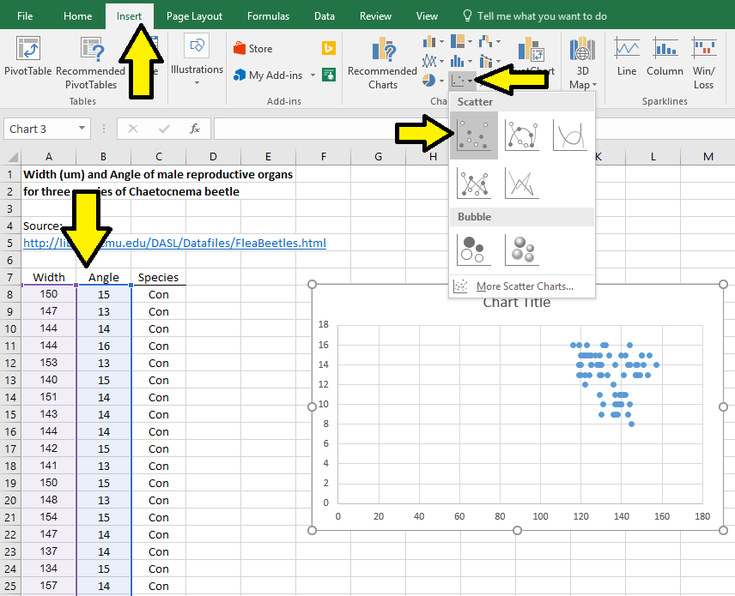
Scatter Plot
Be sure you have your data in columns, with the X-axis variable to the left of the Y-axis variable data. Select your data and click insert > Insert Scatter > Scatter.
Click the graph, and on the design tab select Add Chart Element to include a graph title and axis labels. Often you'll need to adjust the values on the axis so the data is not clumped together on the graph. Right click on the axis and you want to adjust and select Format Axis. On the side menu, adjust the "bounds" so that the data points are spread throughout the graph. You might need to do this for both the X and Y axis values.
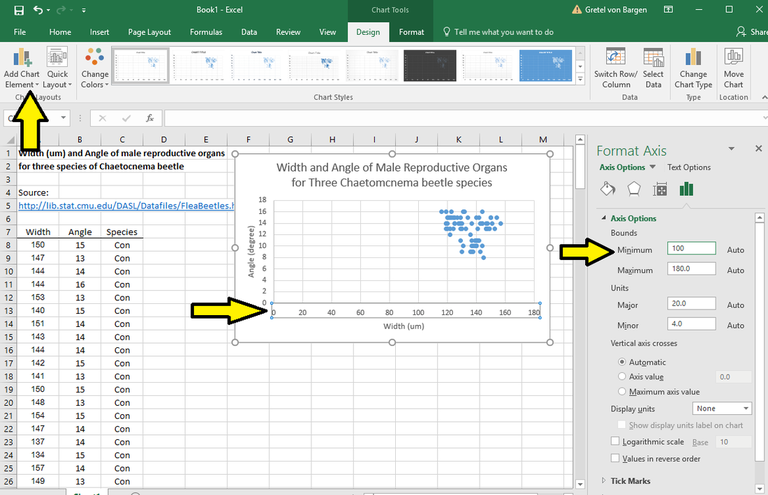
As with the examples above, you can adjust the axis values to ensure the data has the correct and consistent number of digits. Right click on the axis values, and from the side menu select number. In the box, indicate you want a number and then how many digits you want to include after the decimal place.
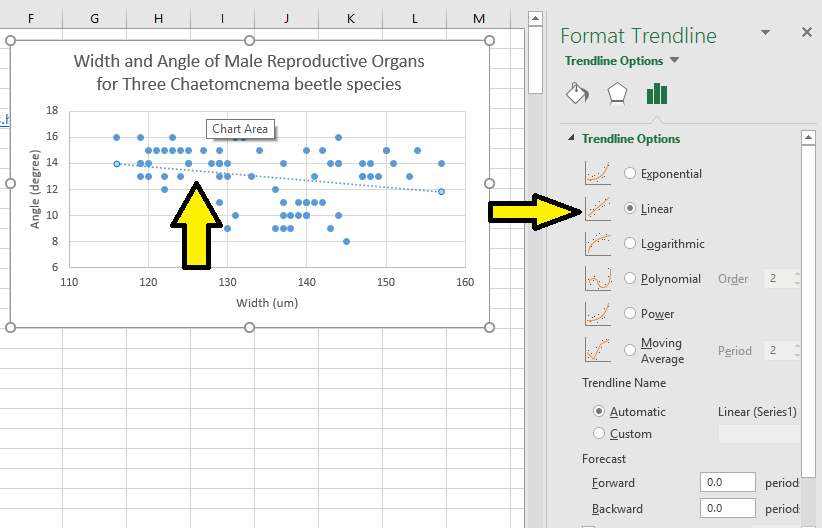
To add a trend line, right click on any data point in your graph and select Add Trend Line. From the side menu, select the type of trend line you want to add.
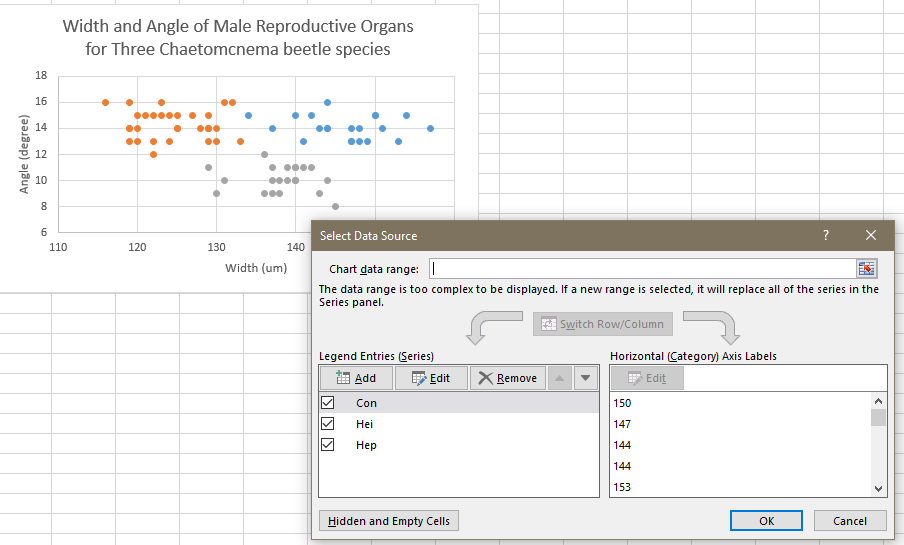
If appropriate for your data set, you can color code the data points so that data collected in different times, places or ways can be differentiated. Right click a data point and chose Select Data. From there you can edit and add different data sources. Each data source will be show as a different color dot.