Outliers
An outlier is a data point that lies an abnormal distance from other values in a data set. 
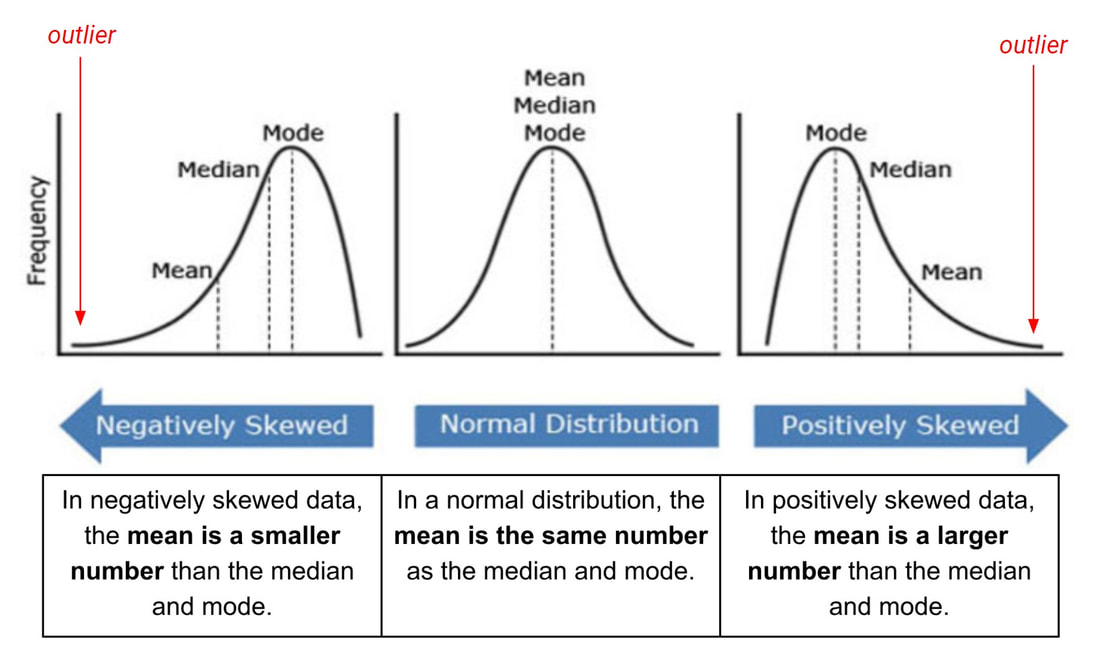
Outliers can cause a data set to be “skewed” from a normal bell curve distribution. By doing so, outliers can have a disproportionate effect on statistical results, such as the mean, which can result in misleading conclusions.
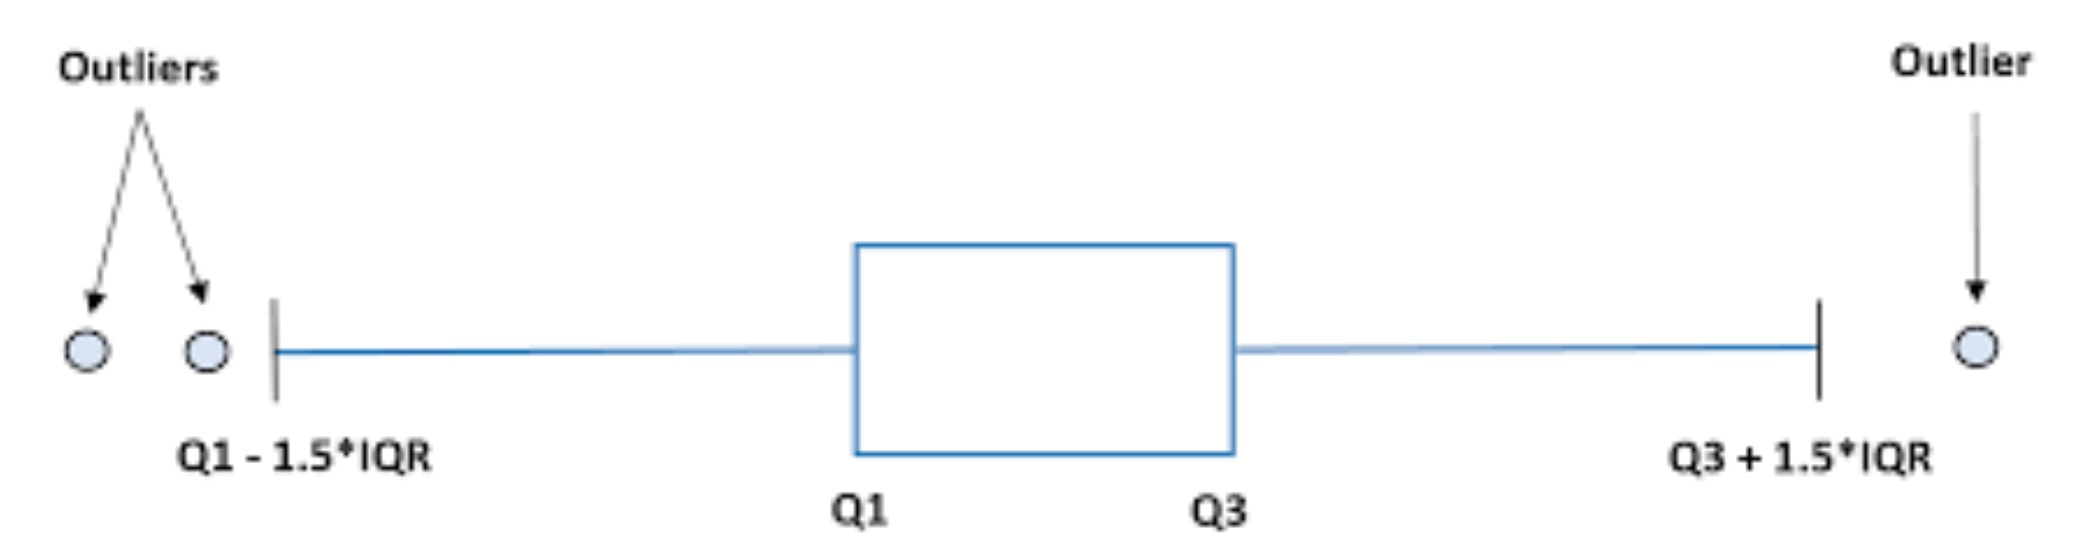
A data point is categorized as an outlier if if falls above or below 1.5 times the IQR. IQR stands for Interquartile Range. The IQR is a measure of dispersion, that represents the range of the middle 50% of the data in a data set. IQR is calculated by subtracting the first quartile (Q1) from the third quartile (Q3).
IQR = Q3 − Q1
Outliers are data points which are above and/or below 1.5 times the IQR.
Any data point that is less than the lower boundary or greater than the upper boundary is considered an outlier. You can use an "outlier IQR calculator" online to help you with these calculations.
- Lower Outlier Boundary: Q1 − (1.5 × IQR)
- Upper Outlier Boundary: Q3 + (1.5 × IQR)
Any data point that is less than the lower boundary or greater than the upper boundary is considered an outlier. You can use an "outlier IQR calculator" online to help you with these calculations.
If there is an outlier in a data set:
Outliers are not always mistakes. Outliers are usually perfectly valid data points that just happen to be a bit unusual. For example, a basketball player's who is 6'8" might be an outlier in a dataset of average student heights, but it's a correct measurement. In these cases, you should not delete them from your analysis.
However, if you have a good reason to believe an outlier is a mistake (like if you're measuring plant growth and one plant's height is entered as 500 cm instead of 50 cm), then exclude that data point from your analysis.
Mean vs. Median
When a dataset contains an outlier, it can heavily influence the mean. A very high outlier will pull the mean up, while a very low one will pull it down, making the mean a less accurate representation of the data's central tendency. In such cases, the median is a better choice for measuring central tendency. The median is the middle value of a dataset when it is ordered from least to greatest. Because it is based on position rather than value, the median is less influenced by outliers and provides a more reliable measure of the "center" of a data set.