BIOLOGY FOR LIFE
  • Syllabus
    • Core >
      • 1: Cell Biology >
        • 1.1: Introduction to Cells
        • 1.2: Ultrastructure of Cells
        • 1.3: Membrane Structure
        • 1.4: Membrane Transport
        • 1.5: The Origin of Cells
        • 1.6: Cell Division
      • 2: Molecular Biology >
        • 2.1: Molecules to Metabolism
        • 2.2: Water
        • 2.3: Carbohydrates and Lipids
        • 2.4: Proteins
        • 2.5: Enzymes
        • 2.6: DNA and RNA
        • 2.7: DNA Replication, Transcription and Translation
        • 2.8: Cell Respiration
        • 2.9: Photosynthesis
      • 3: Genetics >
        • 3.1: Genes
        • 3.2: Chromosomes
        • 3.3: Meiosis
        • 3.4: Inheritance
        • 3.5: Genetic Modification and Biotechnology
      • 4: Ecology >
        • 4.1: Species, Communities and Ecosystems
        • 4.2: Energy Flow
        • 4.3: Carbon Cycling
        • 4.4: Climate Change
      • 5: Evolution and Biodiversity >
        • 5.1: Evidence for Evolution
        • 5.2: Natural Selection
        • 5.3: Classification and Biodiversity
        • 5.4: Cladistics
      • 6: Human Physiology >
        • 6.1: Digestion and Absorption
        • 6.2: The Blood System
        • 6.3: Defense Against Infectious Disease
        • 6.4: Gas Exchange
        • 6.5: Neurons and Synapses
        • 6.6: Hormones, Homeostasis and Reproduction
    • Higher Level >
      • 7: Nucleic Acids >
        • 7.1: DNA Structure and Replication
        • 7.2: Transcription and Gene Expression
        • 7.3: Translation
      • 8: Metabolism, Cell Respiration & Photosynthesis >
        • 8.1: Metabolism
        • 8.2: Cell Respiration
        • 8.3: Photosynthesis
      • 9: Plant Biology >
        • 9.1: Transport in the Xylem of Plants
        • 9.2: Transport in the Phloem of Plants
        • 9.3: Growth in Plants
        • 9.4: Reproduction in Plants
      • 10: Genetics and Evolution >
        • 10.1: Meiosis
        • 10.2: Inheritance
        • 10.3: Gene Pools and Speciation
      • 11: Animal Physiology >
        • 11.1: Antibody Production and Vaccination
        • 11.2: Movement
        • 11.3: Kidney and Osmoregulation
        • 11.4: Sexual Reproduction
    • Options >
      • D: Human Physiology >
        • D.1: Human Nutrition
        • D.2: Digestion
        • D.3: Functions of the Liver
        • D.4: The Heart
        • D.5: Hormones and Metabolism
        • D.6: Transport of Respiratory Gases
  • IB Requirements
    • Learner Profile
    • Group 4 Project
    • External Exam
    • Internal Assessment >
      • Personal Engagement
      • Exploration
      • Analysis
      • Evaluation
      • Communication
    • Extended Essay
  • Investigation Skills
    • Lab Safety
    • Microscopy
    • Lab Drawings
    • Data Tables
    • Measurement
    • Statistics >
      • Descriptive Statistics >
        • Skew
        • Measures of Central Tendancy
        • Measures of Spread
        • Pearson Correlation
      • Inferential Statistics >
        • T-Test
        • ANOVA
        • Kruskal-Wallis
        • X2 Test for Independence
        • X2 Goodness of Fit
    • Graphing >
      • Graphing with Excel
      • Interpreting Error Bars
    • Error Analysis
  • Course Info
    • Above & Beyond >
      • Biology Club
      • Pumpkin Carving
      • Scavenger Hunt
      • Science News
      • IB Bio Dance
      • Wood Duck Project
      • Invasive Crayfish Project
    • Assessment >
      • Class Grading IB Bio I
      • Class Grading IB Bio II
      • Daily Quizzes
      • Lab Practicals
    • Class Photos
    • Recommendations
    • Supplemental Reading
  • Contact
  • About
    • Philosophy
    • Resume
    • Reflection
    • Site Feedback
    • Favorite Quotes
    • AEF Blog
  • Expeditions
    • Bahamas (2009)
    • Trinidad (2010)
    • Trinidad (2011)
    • Ecuador (2012)
    • Trinidad (2013)
    • Peru (2014)
    • Bahamas (2015)
    • Peru (2016)
    • Costa Rica (2017)
    • Costa Rica (2018)
    • Arizona (2022)
    • Florida (2023)
  • Summer Ecology Research

Inferential Statistics 

Inferential statistics are mathematical calculations performed to determine if the results from your sample of data are likely due to chance or are a true representation of the population. Inferential statistics are used to determine the probability of chance alone leading to your sampled results.  
  • “Significant” = the results are very unlikely to have occurred due to chance.
  • “Not significant” = the results could have to have occurred due to chance.

A few other key terms for inferential statistics:
  • Significance level = the probability of saying a result is significant (not due to chance) when it actually was due to chance.  A significance level of 0.05 (the standard used in biology) indicates a 5% risk of concluding that a result is significant when it was actually due to chance.
  • p value = the probability value (p-value) is the probability of obtaining the sampling results due to chance.  
    • The smaller the p-value, the stronger the evidence that the results are significant (not due to chance).   
    • In biology, a p-value of less than 0.05 is considered significant. A p-value greater than 0.05 is considered non-significant. 
    • P values are expressed as decimals although it may be easier to understand what they are if you convert them to a percentage. For example, a p value of 0.0254 is 2.54%. This means there is a 2.54% chance your results could be random (i.e. happened by chance). Since 2.54% (0.0254) is less than 5.00% (0.05), we would say this result is “significant.”

​The following factors contribute to determining if a statistical test is significant:
  1. How large is the difference between the means/medians of the groups? Other factors being equal, the greater the difference between central tendency, the greater the likelihood that a statistically significant difference exists. If the means/medians of groups are far apart, we can be fairly confident that there is a real difference between them.
  2. How much overlap is there between the groups? This is a function of the variation within the groups. Other factors being equal, the smaller the variances of the groups under consideration, the greater the likelihood that a statistically significant difference exists. We can be more confident that two groups differ when the scores within each group are close together.
  3. How many measures (trials or data points) are in the samples? The size of the sample (n) is extremely important in determining the significance. With increased sample size, measurements of the sample tend to become more stable representations of the population. If the result we find remains constant as we collect more and more data, we become more confident that we can trust the effect that we are finding.
  4. What significance level is being used to test the significance (how confident do you want to be about your conclusion)? A larger significance level requires less confidence in the conclusion. It is much harder to conclude a result is significant when you are only willing to have your results occur by chance 1 out of a 100 times (p < .01) as compared to 5 out of 100 times (p < .05).

In most research settings, there are two very distinct types of hypotheses: 
  • the research/experimental hypothesis - a statement of an expected or predicted relationship between two or more variables. It’s what the experimenter believes will happen in the research study. This hypothesis sets the stage to design a study to collect data to test its truth or falsity.  In your IA, the research hypothesis is usually written at the end of your background information.
  • the statistical hypotheses - the null and alternative hypothesis of inferential statistical tests. The statistical hypotheses are statements about whether a pattern/trend/difference is SIGNIFICANT (meaning, likely due to more than chance in sampling).  The statistical hypotheses do not necessarily provide support for or against the research hypothesis that was tested. They just indicate whether chance alone likely could be the reason for the results. 
 
​The statistical hypotheses are:
  •  Null hypothesis (H0).  The null hypothesis states that the results could be due to chance, that there is no significant relationship/difference compared to what could have resulted from random chance in sampling.
  •  Alternative Hypothesis (H1).  The alternative hypothesis states that results are not likely due to chance,  that there is a significant relationship/difference compared to what could have resulted from random chance in sampling.


The type of inferential analysis you perform depends on your research question and the type of data collected.  I think it is easiest to select the inferential analysis tool based on your graph!  
Bar chart:  
 Your data was not skewed (meaning it fit a normal distribution), so you graphed the MEAN with STANDARD DEVIATION using a bar chart.  Your manipulated variable was qualitative.  Both the T-test and ANOVA are used to determine if there is a significant difference between the means for the different levels of your manipulated variable.
  • T-Test if you have two levels of manipulation
    • Paired T-test if the two levels are from “before and after” data
    • ​Unpaired T-test if the two levels are not collected from the same sample before and after a treatment
  • ANOVA if you have three or more levels of manipulation.
Picture
​Box and Whisker: 
You graphed the MEDIAN with QUARTILE bars using a box and whisker chart because your data was skewed (meaning it did not fit a normal distribution curve).  Kruskal-Wallis is used to determine if there is a significant difference between the medians of the different levels of your manipulated variable.
Picture
Stacked-bar Chart:
You created a stacked bar chart because you have levels of manipulation and a qualitative responding variable.  The Chi-Square Goodness of Fit test of tells you if a  difference exists between your observed counts and the counts you would expect if there were no relationship at all in the population.
Picture
Pie Chart:
You created a pie chart because you do not have levels of manipulation and you had a qualitative responding variable.  The Chi-Square Goodness of Fit test of tells you if a  difference exists between your observed counts and the counts you would expect if there were no relationship at all in the population.
Picture
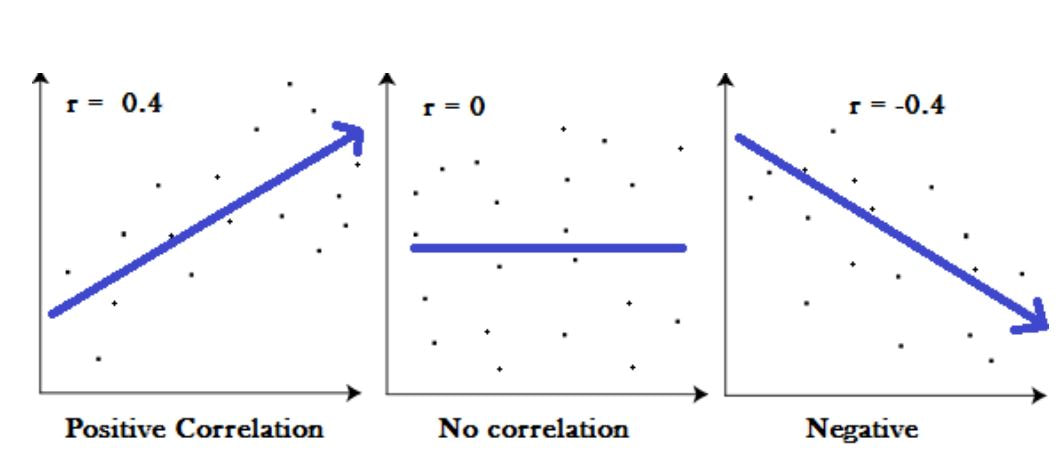
Scatterplots and Line Graphs with a LINEAR relationship:
You created a scatter plot OR you graphed the mean with standard deviation bars using a line graph because your manipulated variable was quantitative. You added a LINEAR trendline.  The Pearson’s Correlation (bottom of the page) is the test statistics that measures the statistical relationship, or association, between two continuous variables.
Picture
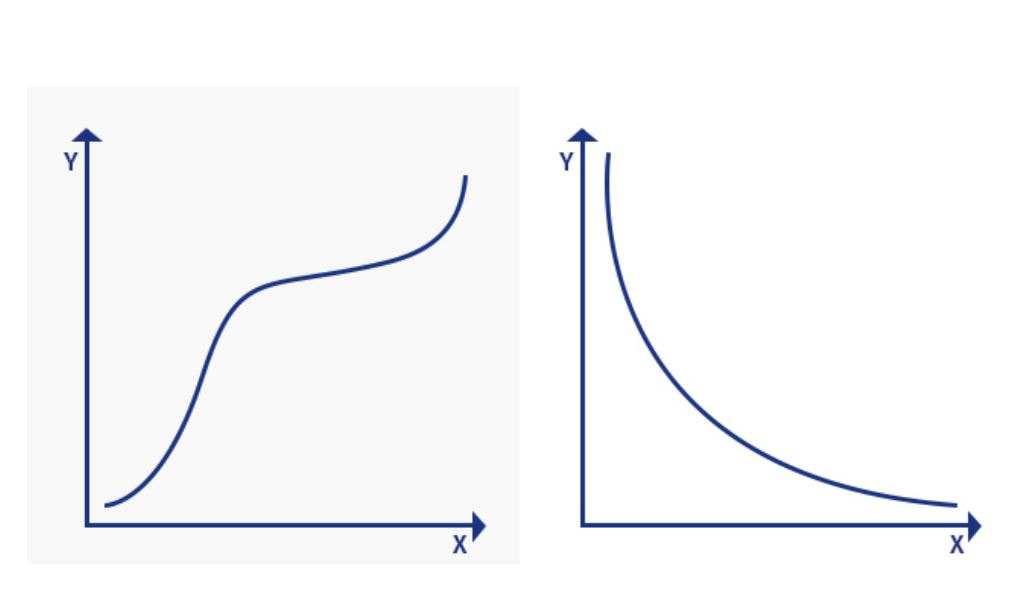
Scatterplots and Line Graphs with a NON-LINEAR but MONOTONIC relationship:
You created a scatter plot OR you graphed the mean with standard deviation bars using a line graph because your manipulated variable was quantitative. You added a NON-LINEAR trendline and the data is MONOTONIC (meaning, X and Y have a consistent relationship, positive, negative or inverse).  Spearman's Rank Correlation is a measure of correlation for data that is non-linear. It assesses how well the relationship between two variables can be described using a monotonic function.
Picture
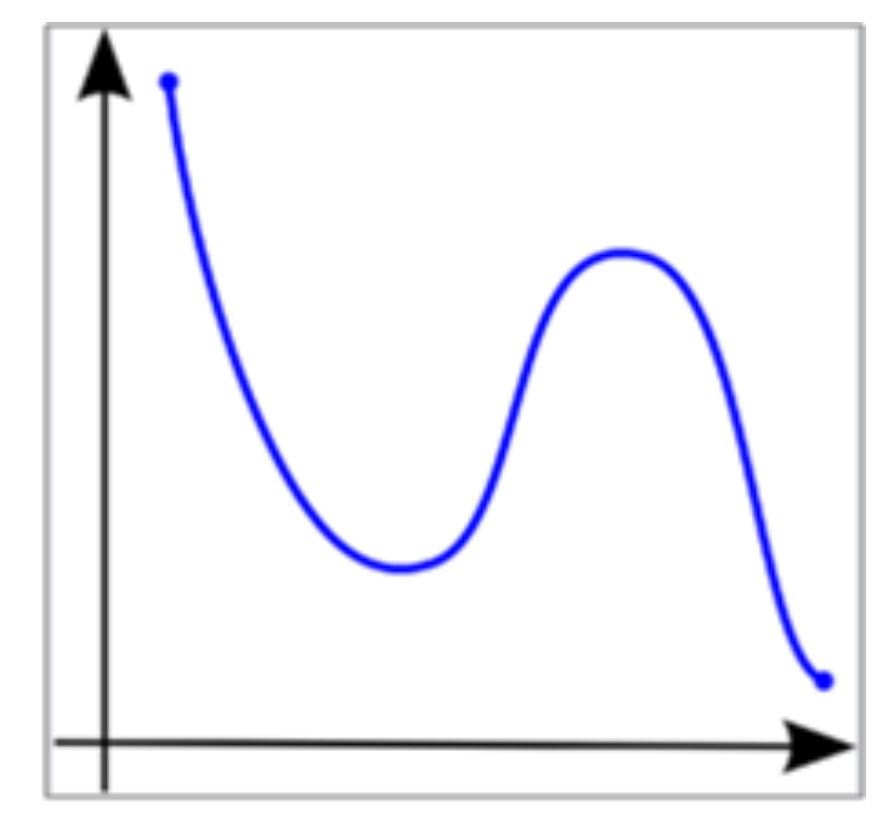
Scatterplots and Line Graphs with a NON-LINEAR and NON-MONOTONIC relationship
You created a scatter plot OR you graphed the mean with standard deviation bars using a line graph because your manipulated variable was quantitative. You added a NON-LINEAR trendline and the data is NON-MONOTONIC (meaning, sometimes Y increases and sometimes Y decreases with X).  ANOVA is used to determine if there is a significant difference between different levels of your manipulated variable.
Picture
I give many of my IB Biology resources away, for the benefit of students and teachers around the world. 
If you've found the materials helpful, please consider making a contribution of any amount
to 
this Earthwatch Expedition Fund. 

​Did I forget something?  Know of a mistake? Have a suggestion?  Let me know by emailing me here.

Before using any of the files available on this site,
​please familiarize yourself with the 
Creative Commons Attribution License. 
​​​It prohibits the use of any material on this site for commercial  purposes of any kind.  ​


"When we try to pick out anything by itself, we find it hitched to everything else in the Universe." 
 John Muir,   1911
  • Syllabus
    • Core >
      • 1: Cell Biology >
        • 1.1: Introduction to Cells
        • 1.2: Ultrastructure of Cells
        • 1.3: Membrane Structure
        • 1.4: Membrane Transport
        • 1.5: The Origin of Cells
        • 1.6: Cell Division
      • 2: Molecular Biology >
        • 2.1: Molecules to Metabolism
        • 2.2: Water
        • 2.3: Carbohydrates and Lipids
        • 2.4: Proteins
        • 2.5: Enzymes
        • 2.6: DNA and RNA
        • 2.7: DNA Replication, Transcription and Translation
        • 2.8: Cell Respiration
        • 2.9: Photosynthesis
      • 3: Genetics >
        • 3.1: Genes
        • 3.2: Chromosomes
        • 3.3: Meiosis
        • 3.4: Inheritance
        • 3.5: Genetic Modification and Biotechnology
      • 4: Ecology >
        • 4.1: Species, Communities and Ecosystems
        • 4.2: Energy Flow
        • 4.3: Carbon Cycling
        • 4.4: Climate Change
      • 5: Evolution and Biodiversity >
        • 5.1: Evidence for Evolution
        • 5.2: Natural Selection
        • 5.3: Classification and Biodiversity
        • 5.4: Cladistics
      • 6: Human Physiology >
        • 6.1: Digestion and Absorption
        • 6.2: The Blood System
        • 6.3: Defense Against Infectious Disease
        • 6.4: Gas Exchange
        • 6.5: Neurons and Synapses
        • 6.6: Hormones, Homeostasis and Reproduction
    • Higher Level >
      • 7: Nucleic Acids >
        • 7.1: DNA Structure and Replication
        • 7.2: Transcription and Gene Expression
        • 7.3: Translation
      • 8: Metabolism, Cell Respiration & Photosynthesis >
        • 8.1: Metabolism
        • 8.2: Cell Respiration
        • 8.3: Photosynthesis
      • 9: Plant Biology >
        • 9.1: Transport in the Xylem of Plants
        • 9.2: Transport in the Phloem of Plants
        • 9.3: Growth in Plants
        • 9.4: Reproduction in Plants
      • 10: Genetics and Evolution >
        • 10.1: Meiosis
        • 10.2: Inheritance
        • 10.3: Gene Pools and Speciation
      • 11: Animal Physiology >
        • 11.1: Antibody Production and Vaccination
        • 11.2: Movement
        • 11.3: Kidney and Osmoregulation
        • 11.4: Sexual Reproduction
    • Options >
      • D: Human Physiology >
        • D.1: Human Nutrition
        • D.2: Digestion
        • D.3: Functions of the Liver
        • D.4: The Heart
        • D.5: Hormones and Metabolism
        • D.6: Transport of Respiratory Gases
  • IB Requirements
    • Learner Profile
    • Group 4 Project
    • External Exam
    • Internal Assessment >
      • Personal Engagement
      • Exploration
      • Analysis
      • Evaluation
      • Communication
    • Extended Essay
  • Investigation Skills
    • Lab Safety
    • Microscopy
    • Lab Drawings
    • Data Tables
    • Measurement
    • Statistics >
      • Descriptive Statistics >
        • Skew
        • Measures of Central Tendancy
        • Measures of Spread
        • Pearson Correlation
      • Inferential Statistics >
        • T-Test
        • ANOVA
        • Kruskal-Wallis
        • X2 Test for Independence
        • X2 Goodness of Fit
    • Graphing >
      • Graphing with Excel
      • Interpreting Error Bars
    • Error Analysis
  • Course Info
    • Above & Beyond >
      • Biology Club
      • Pumpkin Carving
      • Scavenger Hunt
      • Science News
      • IB Bio Dance
      • Wood Duck Project
      • Invasive Crayfish Project
    • Assessment >
      • Class Grading IB Bio I
      • Class Grading IB Bio II
      • Daily Quizzes
      • Lab Practicals
    • Class Photos
    • Recommendations
    • Supplemental Reading
  • Contact
  • About
    • Philosophy
    • Resume
    • Reflection
    • Site Feedback
    • Favorite Quotes
    • AEF Blog
  • Expeditions
    • Bahamas (2009)
    • Trinidad (2010)
    • Trinidad (2011)
    • Ecuador (2012)
    • Trinidad (2013)
    • Peru (2014)
    • Bahamas (2015)
    • Peru (2016)
    • Costa Rica (2017)
    • Costa Rica (2018)
    • Arizona (2022)
    • Florida (2023)
  • Summer Ecology Research