BIOLOGY FOR LIFE
  • IB Bio Syllabus
    • Unity and Diversity (A) >
      • A1 molecules >
        • A1.1: Water
        • A1.2: Nucleic Acids
      • A2 Cells >
        • A2.1: Origins of Cells
        • A2.2: Cell Structure
        • A2.3: Viruses
      • A3 Organisms >
        • A3.1: Diversity of Organisms
        • A3.2: Classification and Cladistics
      • A4 Ecosystems >
        • A4.1: Evolution and Speciation
        • A4.2: Conservation of Biodiversity
    • Form and Function (B) >
      • B1 Molecules >
        • B1.1: Carbohydrates and Lipids
        • B1.2: Proteins
      • B2 Cells >
        • B2.1 Membranes and Membrane Transport
        • B2.2 Organelles and Compartmentalization
        • B2.3 Cell Specialization
      • B3 Organisms >
        • B3.1 Gas Exchange
        • B3.2 Transport
        • B3.3 Muscle and Motility
      • B4 Ecosystems >
        • B4.1 Adaptation to Environment
        • B4.2 Ecological Niches
    • Interaction and Interdependence (C) >
      • C1 Molecules >
        • C1.1: Enzymes and Metabolism
        • C1.2: Cell Respiration
        • C1.3: Photosynthesis
      • C2 Cells >
        • C2.1: Chemical Signaling
        • C2.2: Neural Signaling
      • C3 Organisms >
        • C3.1: Integration of Body Systems
        • C3.2: Defense Against Disease
      • C4 Ecosystems >
        • C4.1 Populations and Communities
        • C4.2 Transfers of Energy and Matter
    • Continuity and Change (D) >
      • D1 Molecules >
        • D1.1: DNA Replication
        • D1.2: Protein Synthesis
        • D1.3: Mutation and Gene Editing
      • D2 Cells >
        • D2.1: Cell and Nuclear Division
        • D2.2: Gene Expression
        • D2.3: Water Potential
      • D3 Organisms >
        • D3.1: Reproduction
        • D3.2: Inheritance
        • D3.3: Homeostasis
      • D4 Ecosystems >
        • D4.1: Natural Selection
        • D4.2: Stability and Change
        • D4.3: Climate Change
  • IB Requirements
    • Internal Assessment >
      • Research Design
      • Analysis
      • Conclusion
      • Evaluation
    • External Assessment >
      • Exam Revision
    • Extended Essay
    • Reflective Project
    • Collaborative Sciences Project
    • Learner Profile
  • Skills for Biology
    • Tools >
      • Experimental Techniques >
        • Addressing Safety
        • Measuring Variables >
          • Lab Drawings
          • Measurement Uncertainty
        • Techniques >
          • Microscopy
      • Technology >
        • Graphing with Excel
      • Mathematics >
        • Statistics >
          • Glossary of Statistic Terms and Equations
          • Descriptive Statistics >
            • Skew and the Normal Distribution
            • Outliers
            • Measures of Central Tendancy
            • Measures of Spread
            • Pearson Correlation
          • Inferential Statistics >
            • T-Test
            • ANOVA
            • Kruskal-Wallis
            • X2 Test for Independence
            • X2 Goodness of Fit
        • Graphing >
          • Interpreting Error Bars
    • Inquiry Processes >
      • Exploring & Designing >
        • Research Questions
        • Hypotheses and Predictions
        • Varaibles
        • Sampling
      • Collecting & Processing Data >
        • Data Tables
      • Concluding & Evaluating >
        • Error Analysis
  • SHS Course Info
    • Above & Beyond >
      • Biology Club
      • Pumpkin Carving
      • Scavenger Hunt
      • Science News
      • Wood Duck Project (legacy)
      • Invasive Crayfish Project (legacy)
    • Assessment >
      • Class Grading IB Bio I
      • Class Grading IB Bio II
      • Daily Quizzes (legacy)
      • Lab Practicals (legacy)
    • Class Photos
    • Recommendations
  • Contact
    • About >
      • Philosophy
      • Resume
      • Reflection
      • Favorite Quotes
      • AEF Blog
  • Expeditions
    • Bahamas (2009)
    • Trinidad (2010)
    • Trinidad (2011)
    • Ecuador (2012)
    • Trinidad (2013)
    • Peru (2014)
    • Bahamas (2015)
    • Peru (2016)
    • Costa Rica (2017)
    • Costa Rica (2018)
    • Arizona (2022)
    • Florida (2023)
    • Belize (2024)
    • Costa Rica (2025)
  • Summer Ecology Research
  • Teacher Resources

Interpreting Error Bars

What is an Error Bar?

An error bar is a line through a point on a graph, parallel to one of the axes, which represents the variation or spread relative to corresponding point (which is usually a central tendency, such as mean).  In IB Biology, the error bars most often represent the standard deviation of a data set relative to the mean.  Click here to learn what the standard deviation is or here to learn how to add standard deviation error bars to a graph.

Example graphs with error bars:
Picture
Picture
Why Include Error Bars on a Graph?

Error bars can communicate the following information about your data:
  • How spread the data are around the mean value (small SD bar = low spread, data are clumped around the mean; larger SD bar = larger spread, data are more variable from the mean).

  • The reliability of the mean value as a representative number for the data set.  In other words, how accurately the mean value represents the data (small SD bar = more reliable, larger SD bar = less reliable).  It's important to note that just because you have a larger SD, it does not indicate your data is not valid.  Biological measurements are notoriously variable.
​
  • The likelihood of there being a significant difference between between data sets.  More on this below...
What do Error Bars Indicate about Statistical Significance?

A "significant result" means that the results that are seen are most likely not due to chance.  In any experiment or observation that involves sampling from a population, there is always the possibility that an observed effect would have occurred due to chance alone.  But if result is "significant,"  then the investigator may conclude that the observed effect actually reflects the characteristics of the population rather than just sampling error or chance.  

​The standard deviation error bars on a graph can be used to get a sense for whether or not a difference is significant.  Look for overlap between the standard deviation bars:
Picture
Picture
Picture
When standard deviation errors bars overlap quite a bit, it's a clue that the difference is not statistically significant.  You must actually perform a statistical test to draw a conclusion. 
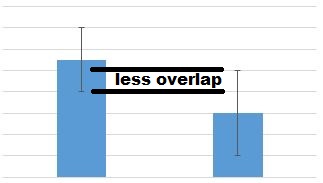
When standard deviation errors bars overlap even less, it's a clue that the difference is probably not statistically significant.  ​You must actually perform a statistical test to draw a conclusion.
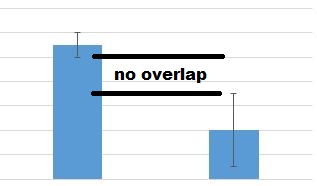
When standard deviation error bars do not overlap, it's a clue that the difference may be significant, but you cannot be sure.  You must actually perform a statistical test to draw a conclusion.
The standard deviation is NOT a statistical test, rather the standard deviation is a measure of variability.  To assess statistical significance, the sample size must also be taken into account.  Therefore, while standard deviation error bars can give you a clue about statistical significance, you must actually perform a statistical test to draw a valid conclusion. 

For more, you can read the article "Error bars in experimental biology."
I give many of my IB Biology resources away, for the benefit of students and teachers around the world. 
If you've found the materials helpful, please consider making a contribution of any amount
to this Earthwatch Expedition Fund or donating a puzzle to our classroom from our wish list.


​Did I forget something?  Know of a mistake? Have a suggestion?  Let me know by emailing me here.

Before using any of the files available on this site,
​please familiarize yourself with the 
Creative Commons Attribution License. 
​​​It prohibits the use of any material on this site for commercial  purposes of any kind.  ​
​
Picture
  • IB Bio Syllabus
    • Unity and Diversity (A) >
      • A1 molecules >
        • A1.1: Water
        • A1.2: Nucleic Acids
      • A2 Cells >
        • A2.1: Origins of Cells
        • A2.2: Cell Structure
        • A2.3: Viruses
      • A3 Organisms >
        • A3.1: Diversity of Organisms
        • A3.2: Classification and Cladistics
      • A4 Ecosystems >
        • A4.1: Evolution and Speciation
        • A4.2: Conservation of Biodiversity
    • Form and Function (B) >
      • B1 Molecules >
        • B1.1: Carbohydrates and Lipids
        • B1.2: Proteins
      • B2 Cells >
        • B2.1 Membranes and Membrane Transport
        • B2.2 Organelles and Compartmentalization
        • B2.3 Cell Specialization
      • B3 Organisms >
        • B3.1 Gas Exchange
        • B3.2 Transport
        • B3.3 Muscle and Motility
      • B4 Ecosystems >
        • B4.1 Adaptation to Environment
        • B4.2 Ecological Niches
    • Interaction and Interdependence (C) >
      • C1 Molecules >
        • C1.1: Enzymes and Metabolism
        • C1.2: Cell Respiration
        • C1.3: Photosynthesis
      • C2 Cells >
        • C2.1: Chemical Signaling
        • C2.2: Neural Signaling
      • C3 Organisms >
        • C3.1: Integration of Body Systems
        • C3.2: Defense Against Disease
      • C4 Ecosystems >
        • C4.1 Populations and Communities
        • C4.2 Transfers of Energy and Matter
    • Continuity and Change (D) >
      • D1 Molecules >
        • D1.1: DNA Replication
        • D1.2: Protein Synthesis
        • D1.3: Mutation and Gene Editing
      • D2 Cells >
        • D2.1: Cell and Nuclear Division
        • D2.2: Gene Expression
        • D2.3: Water Potential
      • D3 Organisms >
        • D3.1: Reproduction
        • D3.2: Inheritance
        • D3.3: Homeostasis
      • D4 Ecosystems >
        • D4.1: Natural Selection
        • D4.2: Stability and Change
        • D4.3: Climate Change
  • IB Requirements
    • Internal Assessment >
      • Research Design
      • Analysis
      • Conclusion
      • Evaluation
    • External Assessment >
      • Exam Revision
    • Extended Essay
    • Reflective Project
    • Collaborative Sciences Project
    • Learner Profile
  • Skills for Biology
    • Tools >
      • Experimental Techniques >
        • Addressing Safety
        • Measuring Variables >
          • Lab Drawings
          • Measurement Uncertainty
        • Techniques >
          • Microscopy
      • Technology >
        • Graphing with Excel
      • Mathematics >
        • Statistics >
          • Glossary of Statistic Terms and Equations
          • Descriptive Statistics >
            • Skew and the Normal Distribution
            • Outliers
            • Measures of Central Tendancy
            • Measures of Spread
            • Pearson Correlation
          • Inferential Statistics >
            • T-Test
            • ANOVA
            • Kruskal-Wallis
            • X2 Test for Independence
            • X2 Goodness of Fit
        • Graphing >
          • Interpreting Error Bars
    • Inquiry Processes >
      • Exploring & Designing >
        • Research Questions
        • Hypotheses and Predictions
        • Varaibles
        • Sampling
      • Collecting & Processing Data >
        • Data Tables
      • Concluding & Evaluating >
        • Error Analysis
  • SHS Course Info
    • Above & Beyond >
      • Biology Club
      • Pumpkin Carving
      • Scavenger Hunt
      • Science News
      • Wood Duck Project (legacy)
      • Invasive Crayfish Project (legacy)
    • Assessment >
      • Class Grading IB Bio I
      • Class Grading IB Bio II
      • Daily Quizzes (legacy)
      • Lab Practicals (legacy)
    • Class Photos
    • Recommendations
  • Contact
    • About >
      • Philosophy
      • Resume
      • Reflection
      • Favorite Quotes
      • AEF Blog
  • Expeditions
    • Bahamas (2009)
    • Trinidad (2010)
    • Trinidad (2011)
    • Ecuador (2012)
    • Trinidad (2013)
    • Peru (2014)
    • Bahamas (2015)
    • Peru (2016)
    • Costa Rica (2017)
    • Costa Rica (2018)
    • Arizona (2022)
    • Florida (2023)
    • Belize (2024)
    • Costa Rica (2025)
  • Summer Ecology Research
  • Teacher Resources