BIOLOGY FOR LIFE
  • IB Bio Syllabus
    • Unity and Diversity (A) >
      • A1 molecules >
        • A1.1: Water
        • A1.2: Nucleic Acids
      • A2 Cells >
        • A2.1: Origins of Cells
        • A2.2: Cell Structure
        • A2.3: Viruses
      • A3 Organisms >
        • A3.1: Diversity of Organisms
        • A3.2: Classification and Cladistics
      • A4 Ecosystems >
        • A4.1: Evolution and Speciation
        • A4.2: Conservation of Biodiversity
    • Form and Function (B) >
      • B1 Molecules >
        • B1.1: Carbohydrates and Lipids
        • B1.2: Proteins
      • B2 Cells >
        • B2.1 Membranes and Membrane Transport
        • B2.2 Organelles and Compartmentalization
        • B2.3 Cell Specialization
      • B3 Organisms >
        • B3.1 Gas Exchange
        • B3.2 Transport
        • B3.3 Muscle and Motility
      • B4 Ecosystems >
        • B4.1 Adaptation to Environment
        • B4.2 Ecological Niches
    • Interaction and Interdependence (C) >
      • C1 Molecules >
        • C1.1: Enzymes and Metabolism
        • C1.2: Cell Respiration
        • C1.3: Photosynthesis
      • C2 Cells >
        • C2.1: Chemical Signaling
        • C2.2: Neural Signaling
      • C3 Organisms >
        • C3.1: Integration of Body Systems
        • C3.2: Defense Against Disease
      • C4 Ecosystems >
        • C4.1 Populations and Communities
        • C4.2 Transfers of Energy and Matter
    • Continuity and Change (D) >
      • D1 Molecules >
        • D1.1: DNA Replication
        • D1.2: Protein Synthesis
        • D1.3: Mutation and Gene Editing
      • D2 Cells >
        • D2.1: Cell and Nuclear Division
        • D2.2: Gene Expression
        • D2.3: Water Potential
      • D3 Organisms >
        • D3.1: Reproduction
        • D3.2: Inheritance
        • D3.3: Homeostasis
      • D4 Ecosystems >
        • D4.1: Natural Selection
        • D4.2: Stability and Change
        • D4.3: Climate Change
  • IB Requirements
    • Internal Assessment >
      • Research Design
      • Analysis
      • Conclusion
      • Evaluation
    • External Assessment >
      • Exam Revision
    • Extended Essay
    • Reflective Project
    • Collaborative Sciences Project
    • Learner Profile
  • Skills for Biology
    • Tools >
      • 1. Experimental Techniques >
        • Addressing Safety
        • Measuring Variables >
          • Measurement Uncertainties
          • Observations
          • Biological Drawings
        • Applying Techniques >
          • Microscopy
      • 2. Technology >
        • Tech to Collect Data
        • Tech to Process Data
      • 3. Mathematics >
        • General Math
        • Units and Symbols
        • Processing Uncertainties
        • Graphing >
          • Types of Graphs
          • Graphing with Excel
          • Graphing Error Bars
          • Interpreting Error Bars
    • Inquiry Processes >
      • Exploring & Designing >
        • Research Questions
        • Hypotheses and Predictions
        • Varaibles
        • Sampling
      • Collecting & Processing Data >
        • Data Tables
      • Concluding & Evaluating >
        • Error Analysis
  • Statistics
    • Descriptive Statistics >
      • Skew and the Normal Distribution
      • Outliers
      • Measures of Central Tendancy
      • Measures of Dispersion
      • Correlation Coefficients
      • Coefficient of Determination
    • Inferential Statistics >
      • Standard Error
      • T-Test
      • ANOVA
      • Kruskal-Wallis
      • X2 Test of Independence
      • X2 Goodness of Fit
    • Glossary of Statistic Terms and Equations
  • SHS Course Info
    • Above & Beyond >
      • Biology Club
      • Pumpkin Carving
      • Scavenger Hunt
      • Science News
      • Wood Duck Project (legacy)
      • Invasive Crayfish Project (legacy)
    • Assessment >
      • Class Grading IB Bio I
      • Class Grading IB Bio II
      • Daily Quizzes (legacy)
      • Lab Practicals (legacy)
    • Class Photos
    • Recommendations
  • Contact
    • About >
      • Philosophy
      • Resume
      • Reflection
      • Favorite Quotes
      • AEF Blog
  • Expeditions
    • Bahamas (2009)
    • Trinidad (2010)
    • Trinidad (2011)
    • Ecuador (2012)
    • Trinidad (2013)
    • Peru (2014)
    • Bahamas (2015)
    • Peru (2016)
    • Costa Rica (2017)
    • Costa Rica (2018)
    • Arizona (2022)
    • Florida (2023)
    • Belize (2024)
    • Costa Rica (2025)
  • Summer Ecology Research
  • Teacher Resources

Measures of Central Tendancy

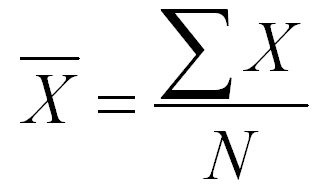
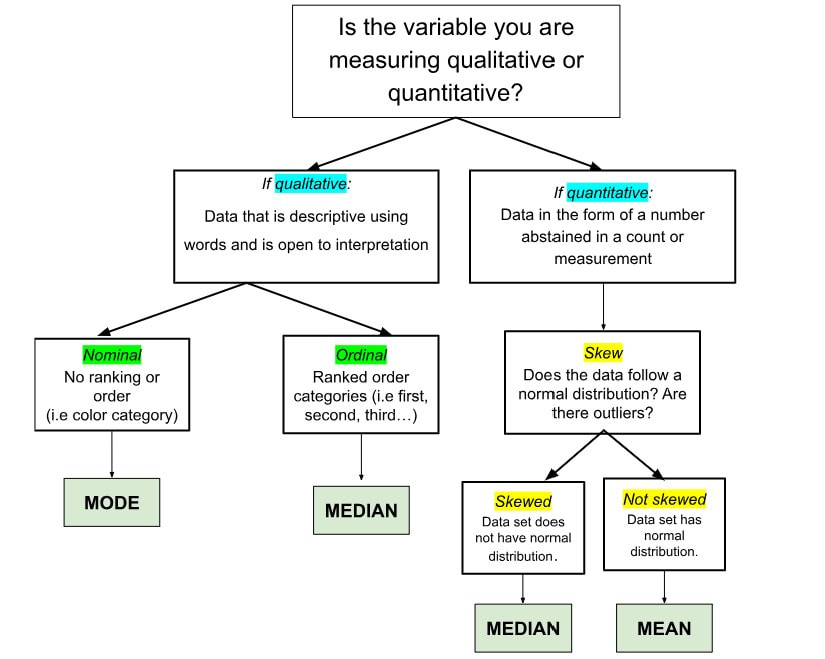
Measures of Central Tendency are ways of describing the central position of a frequency distribution for a group of data using the mean, median, or mode.  Which measure of central tendency is used will depend on how much and the type of data that was collected collected.
Picture
​Type of Data for Responding Variable
​Best Measure of Central Tendency
Qualitative
Nominal (no ranking or order)
Mode
​Qualitative
Ordinal (has ranking or order)
Median
​Quantitative 
With majority of skew values less than |2.0|
Mean
​Quantitative
With majority of skew values more than |2.0|
Median

Mean

The arithmetic mean is the most commonly used measure of central tendency.  The mean is used for normally distributed (non-skewed) data.   The mean has one main disadvantage: it is particularly susceptible to the influence of outliers.  These are values that are unusual compared to the rest of the data set by being especially small or large in numerical value. 
  • DO NOT calculate a mean for skewed data. 
  • ​DO NOT calculate a mean from values that are already averages. 
  • DO NOT calculate a mean when the measurement scale is not linear (i.e. pH units are not measured on a linear scale)
​
The mean is equal to the sum of all the values in the data set divided by the number of values in the data set. So, if we have 'n' number of measurement samples in a data set and they have values x1, x2, … ,xn, the sample mean, usually denoted by x̄ (pronounced "x bar"), is:
Picture

Calculating the Mean in Spreadsheet Software

  • Excel or Google Sheets = AVERAGE(highlight data cells) highlight the cells with data you want to include in the mean calculation.
  • ​Be sure your mean has the correct number of digits. Your processed data should have the same number of digits as your raw data.

Calculating the Mean of a pH

The mean cannot simply be calculated from pH measurements directly because the pH scale is logarithmic; instead, each pH value must be first converted to its corresponding hydrogen ion concentration, then the mean can be calculated from those concentrations.  That average can then be converted back to a pH.
  1. Convert pH values to hydrogen ion concentrations:  For each pH value, use the formula [H+] = 10^(-pH) to calculate the corresponding hydrogen ion concentration. 
  2. Calculate the average concentration: Add up all the calculated hydrogen ion concentrations and divide by the number of values to find the average concentration. 
  3. Convert back to pH: Use the pH formula again: pH = -log(average hydrogen ion concentration) to get the mean pH value.

Median

The median is the middle score for a set of data that has been arranged in order of magnitude. The median should be used if there are outliers or skewed data (meaning the data does not fit a “normal distribution”).  ​ ​

Calculating the Median in Spreadsheet Software

  • Online calculators
  • ​Excel or Google Sheets = MEDIAN(highlight data cells) highlight the cells with data you want to include in the mean calculation.
  • ​Be sure your mean has the correct number of digits. Your processed data should have the same number of digits as your raw data.

Mode

The mode is the most frequent score in a data set.  Calculate the mode by tallying the result that is repeated more often than any other. The mode is the peak of a distribution curve.  Sometimes a distribution as two peaks, which is described as "bimodal."
Picture

Calculating the Mode in Spreadsheet Software

  • Online calculators​​
  • ​Excel or Google Sheets = MODE(highlight data cells) highlight the cells with data you want to include in the mean calculation.
  • ​Be sure your mean has the correct number of digits. Your processed data should have the same number of digits as your raw data.
I give many of my IB Biology resources away, for the benefit of students and teachers around the world. 
If you've found the materials helpful, please consider making a contribution of any amount
to this Earthwatch Expedition Fund or donating a puzzle to our classroom from our wish list.


​Did I forget something?  Know of a mistake? Have a suggestion?  Let me know by emailing me here.

Before using any of the files available on this site,
​please familiarize yourself with the 
Creative Commons Attribution License. 
​​​It prohibits the use of any material on this site for commercial  purposes of any kind.  ​
​
Picture
  • IB Bio Syllabus
    • Unity and Diversity (A) >
      • A1 molecules >
        • A1.1: Water
        • A1.2: Nucleic Acids
      • A2 Cells >
        • A2.1: Origins of Cells
        • A2.2: Cell Structure
        • A2.3: Viruses
      • A3 Organisms >
        • A3.1: Diversity of Organisms
        • A3.2: Classification and Cladistics
      • A4 Ecosystems >
        • A4.1: Evolution and Speciation
        • A4.2: Conservation of Biodiversity
    • Form and Function (B) >
      • B1 Molecules >
        • B1.1: Carbohydrates and Lipids
        • B1.2: Proteins
      • B2 Cells >
        • B2.1 Membranes and Membrane Transport
        • B2.2 Organelles and Compartmentalization
        • B2.3 Cell Specialization
      • B3 Organisms >
        • B3.1 Gas Exchange
        • B3.2 Transport
        • B3.3 Muscle and Motility
      • B4 Ecosystems >
        • B4.1 Adaptation to Environment
        • B4.2 Ecological Niches
    • Interaction and Interdependence (C) >
      • C1 Molecules >
        • C1.1: Enzymes and Metabolism
        • C1.2: Cell Respiration
        • C1.3: Photosynthesis
      • C2 Cells >
        • C2.1: Chemical Signaling
        • C2.2: Neural Signaling
      • C3 Organisms >
        • C3.1: Integration of Body Systems
        • C3.2: Defense Against Disease
      • C4 Ecosystems >
        • C4.1 Populations and Communities
        • C4.2 Transfers of Energy and Matter
    • Continuity and Change (D) >
      • D1 Molecules >
        • D1.1: DNA Replication
        • D1.2: Protein Synthesis
        • D1.3: Mutation and Gene Editing
      • D2 Cells >
        • D2.1: Cell and Nuclear Division
        • D2.2: Gene Expression
        • D2.3: Water Potential
      • D3 Organisms >
        • D3.1: Reproduction
        • D3.2: Inheritance
        • D3.3: Homeostasis
      • D4 Ecosystems >
        • D4.1: Natural Selection
        • D4.2: Stability and Change
        • D4.3: Climate Change
  • IB Requirements
    • Internal Assessment >
      • Research Design
      • Analysis
      • Conclusion
      • Evaluation
    • External Assessment >
      • Exam Revision
    • Extended Essay
    • Reflective Project
    • Collaborative Sciences Project
    • Learner Profile
  • Skills for Biology
    • Tools >
      • 1. Experimental Techniques >
        • Addressing Safety
        • Measuring Variables >
          • Measurement Uncertainties
          • Observations
          • Biological Drawings
        • Applying Techniques >
          • Microscopy
      • 2. Technology >
        • Tech to Collect Data
        • Tech to Process Data
      • 3. Mathematics >
        • General Math
        • Units and Symbols
        • Processing Uncertainties
        • Graphing >
          • Types of Graphs
          • Graphing with Excel
          • Graphing Error Bars
          • Interpreting Error Bars
    • Inquiry Processes >
      • Exploring & Designing >
        • Research Questions
        • Hypotheses and Predictions
        • Varaibles
        • Sampling
      • Collecting & Processing Data >
        • Data Tables
      • Concluding & Evaluating >
        • Error Analysis
  • Statistics
    • Descriptive Statistics >
      • Skew and the Normal Distribution
      • Outliers
      • Measures of Central Tendancy
      • Measures of Dispersion
      • Correlation Coefficients
      • Coefficient of Determination
    • Inferential Statistics >
      • Standard Error
      • T-Test
      • ANOVA
      • Kruskal-Wallis
      • X2 Test of Independence
      • X2 Goodness of Fit
    • Glossary of Statistic Terms and Equations
  • SHS Course Info
    • Above & Beyond >
      • Biology Club
      • Pumpkin Carving
      • Scavenger Hunt
      • Science News
      • Wood Duck Project (legacy)
      • Invasive Crayfish Project (legacy)
    • Assessment >
      • Class Grading IB Bio I
      • Class Grading IB Bio II
      • Daily Quizzes (legacy)
      • Lab Practicals (legacy)
    • Class Photos
    • Recommendations
  • Contact
    • About >
      • Philosophy
      • Resume
      • Reflection
      • Favorite Quotes
      • AEF Blog
  • Expeditions
    • Bahamas (2009)
    • Trinidad (2010)
    • Trinidad (2011)
    • Ecuador (2012)
    • Trinidad (2013)
    • Peru (2014)
    • Bahamas (2015)
    • Peru (2016)
    • Costa Rica (2017)
    • Costa Rica (2018)
    • Arizona (2022)
    • Florida (2023)
    • Belize (2024)
    • Costa Rica (2025)
  • Summer Ecology Research
  • Teacher Resources