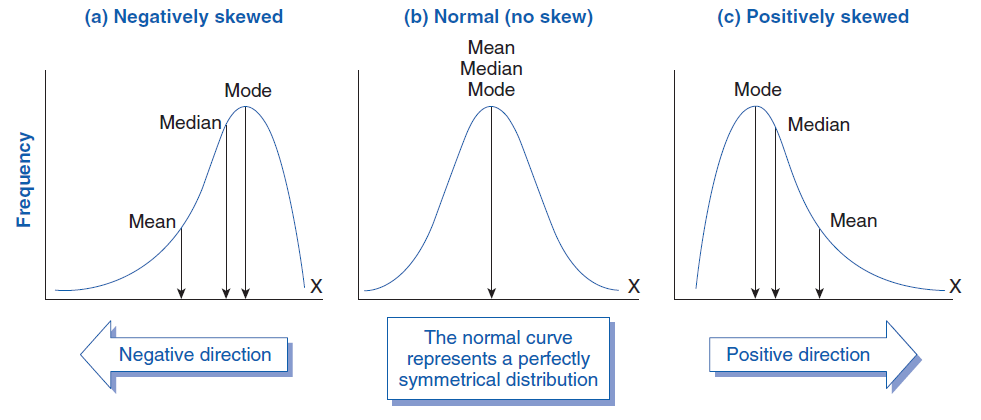
BIOLOGY FOR LIFE
  • IB Bio Syllabus
    • Unity and Diversity (A) >
      • A1 molecules >
        • A1.1: Water
        • A1.2: Nucleic Acids
      • A2 Cells >
        • A2.1: Origins of Cells
        • A2.2: Cell Structure
        • A2.3: Viruses
      • A3 Organisms >
        • A3.1: Diversity of Organisms
        • A3.2: Classification and Cladistics
      • A4 Ecosystems >
        • A4.1: Evolution and Speciation
        • A4.2: Conservation of Biodiversity
    • Form and Function (B) >
      • B1 Molecules >
        • B1.1: Carbohydrates and Lipids
        • B1.2: Proteins
      • B2 Cells >
        • B2.1 Membranes and Membrane Transport
        • B2.2 Organelles and Compartmentalization
        • B2.3 Cell Specialization
      • B3 Organisms >
        • B3.1 Gas Exchange
        • B3.2 Transport
        • B3.3 Muscle and Motility
      • B4 Ecosystems >
        • B4.1 Adaptation to Environment
        • B4.2 Ecological Niches
    • Interaction and Interdependence (C) >
      • C1 Molecules >
        • C1.1: Enzymes and Metabolism
        • C1.2: Cell Respiration
        • C1.3: Photosynthesis
      • C2 Cells >
        • C2.1: Chemical Signaling
        • C2.2: Neural Signaling
      • C3 Organisms >
        • C3.1: Integration of Body Systems
        • C3.2: Defense Against Disease
      • C4 Ecosystems >
        • C4.1 Populations and Communities
        • C4.2 Transfers of Energy and Matter
    • Continuity and Change (D) >
      • D1 Molecules >
        • D1.1: DNA Replication
        • D1.2: Protein Synthesis
        • D1.3: Mutation and Gene Editing
      • D2 Cells >
        • D2.1: Cell and Nuclear Division
        • D2.2: Gene Expression
        • D2.3: Water Potential
      • D3 Organisms >
        • D3.1: Reproduction
        • D3.2: Inheritance
        • D3.3: Homeostasis
      • D4 Ecosystems >
        • D4.1: Natural Selection
        • D4.2: Stability and Change
        • D4.3: Climate Change
  • IB Requirements
    • Internal Assessment >
      • Research Design
      • Analysis
      • Conclusion
      • Evaluation
    • External Assessment >
      • Exam Revision
    • Extended Essay
    • Reflective Project
    • Collaborative Sciences Project
    • Learner Profile
  • Skills for Biology
    • Tools >
      • Experimental Techniques >
        • Addressing Safety
        • Measuring Variables >
          • Measurement Uncertainties
          • Observations
          • Biological Drawings
        • Applying Techniques >
          • Microscopy
      • Technology >
        • Tech to Collect Data
        • Tech to Process Data
      • Mathematics >
        • General Math
        • Units and Symbols
        • Processing Uncertainties
        • Graphing >
          • Types of Graphs
          • How to Graph
          • Graph Error Bars
    • Inquiry Processes >
      • Exploring >
        • Research Questions
        • Hypotheses and Predictions
      • Designing >
        • Variables
        • Sampling
      • Control of Variables
      • Collecting Data >
        • Data Tables
      • Processing Data
      • Interpreting Results
      • Concluding
      • Evaluating >
        • Error Analysis
  • Statistics
    • Descriptive Statistics >
      • Skew and the Normal Distribution
      • Outliers
      • Measures of Central Tendancy
      • Measures of Dispersion
      • Correlation Coefficients
      • Coefficient of Determination
    • Inferential Statistics >
      • Standard Error
      • T-Test
      • ANOVA
      • Kruskal-Wallis
      • X2 Test of Independence
      • X2 Goodness of Fit
    • Glossary of Statistic Terms and Equations
  • SHS Course Info
    • Above & Beyond >
      • Biology Club
      • Pumpkin Carving
      • Scavenger Hunt
      • Science News
      • Wood Duck Project (legacy)
      • Invasive Crayfish Project (legacy)
    • Assessment >
      • Class Grading IB Bio I
      • Class Grading IB Bio II
      • Daily Quizzes (legacy)
      • Lab Practicals (legacy)
    • Class Photos
    • Recommendations
  • Contact
    • About >
      • Philosophy
      • Resume
      • Reflection
      • Favorite Quotes
      • AEF Blog
  • Expeditions
    • Bahamas (2009)
    • Trinidad (2010)
    • Trinidad (2011)
    • Ecuador (2012)
    • Trinidad (2013)
    • Peru (2014)
    • Bahamas (2015)
    • Peru (2016)
    • Costa Rica (2017)
    • Costa Rica (2018)
    • Arizona (2022)
    • Florida (2023)
    • Belize (2024)
    • Costa Rica (2025)
  • Summer Ecology Research
  • Teacher Resources

Skew and the Normal Distribution

The first step in analyzing a data set is to examine it's distribution.  Histograms are a type of graph that scientist use to visualize the variability in measurements within a sample.  Histograms create visual representations of the frequency (Y-axis) of different measurements (X-axis) within the sample.  Each bar of a histogram covers a range of numeric measurement values (called a bin) and the height of the bar indicates the frequency of data points with a value within the corresponding bin.
Picture
From Kemp, Arika & Harding, Chad & Cabral, Wayne & Marini, Joan & Wallace, Joseph. (2012). Effects of tissue hydration on nanoscale structural morphology and mechanics of individual Type I collagen fibrils in the Brtl mouse model of Osteogenesis Imperfecta. Journal of structural biology. 180. 10.1016/j.jsb.2012.09.012.
Histograms often display a normal distribution.  The normal distribution appears as a "bell curve" when graphed. The normal distribution describes a symmetrical plot of data around its mean value.  When data fit a normal distribution, then "parametric" statistics are appropriate  for describing the data.
  • Parametric statistics assume that the data is normally distributed. Parametric tests are often used for continuous data and are more likely to detect an effect if it exists compared to nonparametric statistics. However, outliers can significantly affect the results of parametric statistics. 
  • Nonparametric statistics do not make assumptions about the data distribution and are often used for categorical data or continuous data that is not normally distributed.  Outliers have less of an affect on the results of nonparametric statistics. ​
Skewness is a measure of how well the data in a data set fits a normal distribution.  If the distribution of data for a variable stretches toward the right or left tail of the frequency distribution, then the distribution is characterized as "skewed."  As the data becomes skewed from a normal distribution, the mean loses its ability to provide the best measure of central tendency.
Picture

How to I know if my data is skewed?

 In IB Biology, students often calculate skew for the repeated measurements (trials) for each level of a independent (manipulated) variable.  So, if you had five levels of manipulation, each with 5 trials of measurement, then skew would be calculated 5 times - one time each with the data set for each level of the independent variable. 

  • Use an online SKEW calculator.  Here’s a good option.  Be sure to include a citation in your paper if you use this tool.  
  • Use the “SKEW” function in Microsoft Excel. Here’s directions.  
  • Use the “SKEW” function in Google Sheets.  Here’s the directions. 

A negative skewness indicates a greater number of values in a data set that are larger than the mean, whereas a positive skewness indicates a greater number of values in a data set that smaller than the mean.

The absolute value of the skew number indicates just how skewed the data is.  If skewness = 0, the data are perfectly symmetrical and fit a perfect normal distribution.  However, a skewness of exactly zero is quite unlikely for real-world data.  Hair et al. suggests this rule of thumb when interpreting a skew number: 
  • If skewness is between −.5 and +.5, the distribution is approximately symmetrical.
  • If skewness is between −1 and −.5 or between +.5 and +1, the distribution is slightly skewed.
  • If skewness is less than −1 or greater than +1, the distribution is moderately skewed but acceptable. 
  • Skew values beyond −2 and +2 are considered indicative of substantial nonnormality.

Any absolute value 2.0 or less is fine for using parametric statistics such as the mean as a measure of central tendency.  If the absolute value of the skew is more than 2.0, consider using nonparametric statistics such as median to represent the data.

Hair, J. F., Hult, G. T. M., Ringle, C. M., & Sarstedt, M. (2022). A Primer on Partial Least Squares Structural Equation Modeling (PLS-SEM) (3 ed.). Thousand Oaks, CA: Sage.
Picture
I give many of my IB Biology resources away, for the benefit of students and teachers around the world. 
If you've found the materials helpful, please consider sending a gift from our classroom wish list.


​Did I forget something?  Know of a mistake? Have a suggestion?  Let me know by emailing me here.

Before using any of the files available on this site,
​please familiarize yourself with the 
Creative Commons Attribution License. 
​​​It prohibits the use of any material on this site for commercial  purposes of any kind.  ​
​
Picture
  • IB Bio Syllabus
    • Unity and Diversity (A) >
      • A1 molecules >
        • A1.1: Water
        • A1.2: Nucleic Acids
      • A2 Cells >
        • A2.1: Origins of Cells
        • A2.2: Cell Structure
        • A2.3: Viruses
      • A3 Organisms >
        • A3.1: Diversity of Organisms
        • A3.2: Classification and Cladistics
      • A4 Ecosystems >
        • A4.1: Evolution and Speciation
        • A4.2: Conservation of Biodiversity
    • Form and Function (B) >
      • B1 Molecules >
        • B1.1: Carbohydrates and Lipids
        • B1.2: Proteins
      • B2 Cells >
        • B2.1 Membranes and Membrane Transport
        • B2.2 Organelles and Compartmentalization
        • B2.3 Cell Specialization
      • B3 Organisms >
        • B3.1 Gas Exchange
        • B3.2 Transport
        • B3.3 Muscle and Motility
      • B4 Ecosystems >
        • B4.1 Adaptation to Environment
        • B4.2 Ecological Niches
    • Interaction and Interdependence (C) >
      • C1 Molecules >
        • C1.1: Enzymes and Metabolism
        • C1.2: Cell Respiration
        • C1.3: Photosynthesis
      • C2 Cells >
        • C2.1: Chemical Signaling
        • C2.2: Neural Signaling
      • C3 Organisms >
        • C3.1: Integration of Body Systems
        • C3.2: Defense Against Disease
      • C4 Ecosystems >
        • C4.1 Populations and Communities
        • C4.2 Transfers of Energy and Matter
    • Continuity and Change (D) >
      • D1 Molecules >
        • D1.1: DNA Replication
        • D1.2: Protein Synthesis
        • D1.3: Mutation and Gene Editing
      • D2 Cells >
        • D2.1: Cell and Nuclear Division
        • D2.2: Gene Expression
        • D2.3: Water Potential
      • D3 Organisms >
        • D3.1: Reproduction
        • D3.2: Inheritance
        • D3.3: Homeostasis
      • D4 Ecosystems >
        • D4.1: Natural Selection
        • D4.2: Stability and Change
        • D4.3: Climate Change
  • IB Requirements
    • Internal Assessment >
      • Research Design
      • Analysis
      • Conclusion
      • Evaluation
    • External Assessment >
      • Exam Revision
    • Extended Essay
    • Reflective Project
    • Collaborative Sciences Project
    • Learner Profile
  • Skills for Biology
    • Tools >
      • Experimental Techniques >
        • Addressing Safety
        • Measuring Variables >
          • Measurement Uncertainties
          • Observations
          • Biological Drawings
        • Applying Techniques >
          • Microscopy
      • Technology >
        • Tech to Collect Data
        • Tech to Process Data
      • Mathematics >
        • General Math
        • Units and Symbols
        • Processing Uncertainties
        • Graphing >
          • Types of Graphs
          • How to Graph
          • Graph Error Bars
    • Inquiry Processes >
      • Exploring >
        • Research Questions
        • Hypotheses and Predictions
      • Designing >
        • Variables
        • Sampling
      • Control of Variables
      • Collecting Data >
        • Data Tables
      • Processing Data
      • Interpreting Results
      • Concluding
      • Evaluating >
        • Error Analysis
  • Statistics
    • Descriptive Statistics >
      • Skew and the Normal Distribution
      • Outliers
      • Measures of Central Tendancy
      • Measures of Dispersion
      • Correlation Coefficients
      • Coefficient of Determination
    • Inferential Statistics >
      • Standard Error
      • T-Test
      • ANOVA
      • Kruskal-Wallis
      • X2 Test of Independence
      • X2 Goodness of Fit
    • Glossary of Statistic Terms and Equations
  • SHS Course Info
    • Above & Beyond >
      • Biology Club
      • Pumpkin Carving
      • Scavenger Hunt
      • Science News
      • Wood Duck Project (legacy)
      • Invasive Crayfish Project (legacy)
    • Assessment >
      • Class Grading IB Bio I
      • Class Grading IB Bio II
      • Daily Quizzes (legacy)
      • Lab Practicals (legacy)
    • Class Photos
    • Recommendations
  • Contact
    • About >
      • Philosophy
      • Resume
      • Reflection
      • Favorite Quotes
      • AEF Blog
  • Expeditions
    • Bahamas (2009)
    • Trinidad (2010)
    • Trinidad (2011)
    • Ecuador (2012)
    • Trinidad (2013)
    • Peru (2014)
    • Bahamas (2015)
    • Peru (2016)
    • Costa Rica (2017)
    • Costa Rica (2018)
    • Arizona (2022)
    • Florida (2023)
    • Belize (2024)
    • Costa Rica (2025)
  • Summer Ecology Research
  • Teacher Resources