Pearson Correlation
One of the most common errors found in the media is the confusion between correlation and causation in scientific and health-related studies. In theory, these are easy to distinguish — an action or occurrence can cause another (such as smoking causes lung cancer), or it can correlate with another (such as smoking is correlated with alcoholism). If one action causes another, then they are most certainly correlated. But just because two things occur together does not mean that one caused the other, even if it seems to make sense.
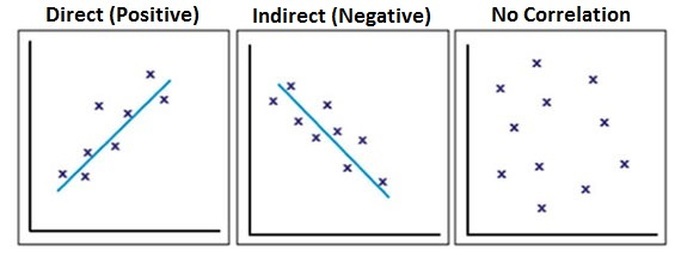
One way to get a general idea about whether or not two variables are related is to plot them on a “scatter plot”. If the dots on the scatter plot tend to go from the lower left to the upper right it means that as one variable goes up the other variable tends to go up also. This is a called a “direct (or positive) relationship.” On the other hand, if the dots on the scatter plot tend to go from the upper left corner to the lower right corner of the scatter plot, it means that as values on one variable go up values on the other variable go down. This is called an “indirect (or negative) relationship."
One way to get a general idea about whether or not two variables are related is to plot them on a “scatter plot”. If the dots on the scatter plot tend to go from the lower left to the upper right it means that as one variable goes up the other variable tends to go up also. This is a called a “direct (or positive) relationship.” On the other hand, if the dots on the scatter plot tend to go from the upper left corner to the lower right corner of the scatter plot, it means that as values on one variable go up values on the other variable go down. This is called an “indirect (or negative) relationship."

Karl Pearson invented a way to calculate a summary number that allows you to answer the question “How strong is the relationship of a correlation?” The statistic was named after him. It is called Pearson’s Correlation Coefficient (r).
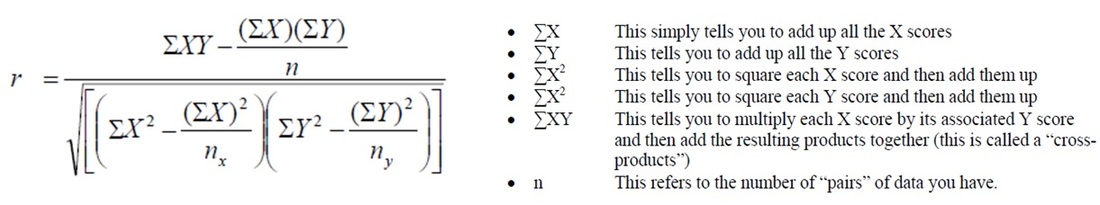
Calculating Pearson Correlation Coefficient
- Online calculators, such as https://www.socscistatistics.com/tests/pearson/default2.aspx
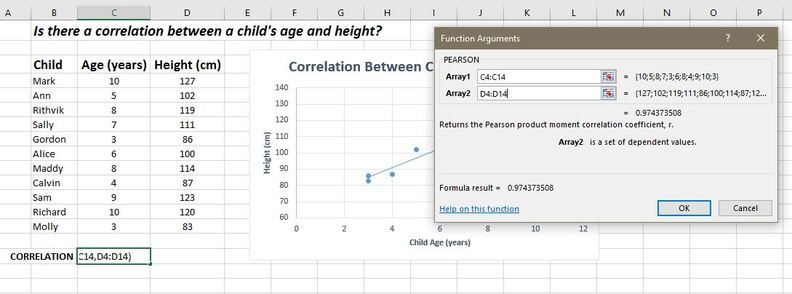
- Excel or Google Sheets =PEARSON(array1, array2)
Step By Step Directions for Calculating a Pearson's r
1. Create a table like this one and fill in your values for each variable. One of the variables is designated as X and the other is designated as Y.
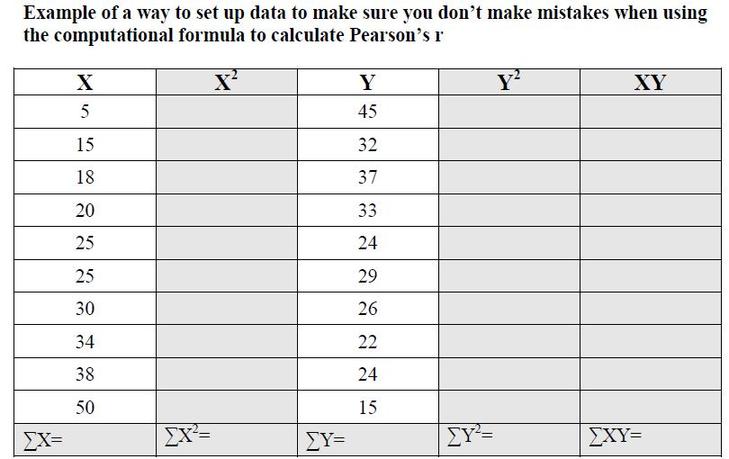
2. Calculate and fill in the X2 and Y2 values
3. Multiply each X score by its paired Y score which will give you the cross-products of X and Y.
4. Fill in the last row of the table which contains all of you “Sum Of” statements. In other words, just add up all of the X scores to get the ΣX, all of the X2 scores to get the Σ X2 and etc.
5. Enter the numbers you have calculated in the spaces where they should go in the formula.
6. Multiply the (ΣX)( ΣY) in the numerator (the top part of the formula) and do the squaring to (ΣX)2 and (ΣY)2 in the denominator (the bottom part of the formula).
7. Do the division by n parts in the formula.
8. Do the subtraction parts of the formula
9. Multiply the numbers in the denominator.
10.Take the square root of the denominator.
11. Take the last step and divide the numerator by the denominator and you will get the Correlation Coefficient!
Important Things Correlation Coefficients Tell You
It Tells You The Direction Of A Relationship:
If your correlation coefficient is a negative number you can tell, just by looking at it, that there is an indirect, negative relationship between the two variables. As you may recall, a negative relationship means that as values on one variable increase (go up) the values on the other variable tend to decrease (go down) in a predictable manner. If your correlation coefficient is a positive number, then you know that you have a direct, positive relationship. This means that as one variable increases (or decreases) the values of the other variable tend to go in the same direction. If one increases, so does the other. If one decreases, so does the other in a predictable manner.
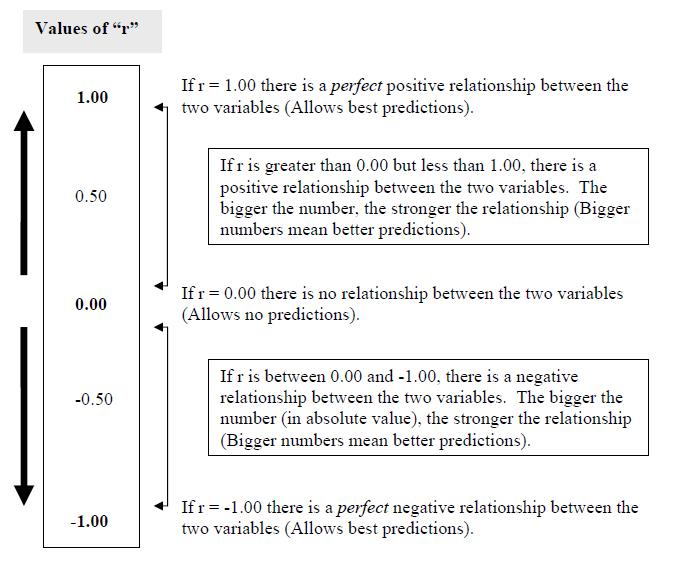
Correlation Coefficients Always Fall Between -1.00 and +1.00:
A correlation coefficient of -1.00 tells you that there is a perfect negative relationship between the two variables. This means that as values on one variable increase there is a perfectly predictable decrease in values on the other variable. In other words, as one variable goes up, the other goes in the opposite direction (it goes down). A correlation coefficient of +1.00 tells you that there is a perfect positive relationship between the two variables. This means that as values on one variable increase there is a perfectly predictable increase in values on the other variable. In other words, as one variable goes up so does the other. A correlation coefficient of 0.00 tells you that there is a zero correlation, or no relationship, between the two variables. In other words, as one variable changes (goes up or down) you can’t really say anything about what happens to the other variable.
Larger Correlation Coefficients Mean Stronger Relationships
Most correlation coefficients (assuming there really is a relationship between the two variables you are examining) tend to be somewhat lower than plus or minus 1.00 (meaning that they are not perfect relationships) but are somewhat above 0.00. Remember that a correlation coefficient of 0.00 means that there is no relationship between your two variables based on the data you are looking at. The closer a correlation coefficient is to 0.00, the weaker the elationship is and the less able you are to tell exactly what happens to one variable based on knowledge of the other variable. The closer a correlation coefficient approaches plus or minus 1.00 the stronger the relationship is and the more accurately you are able to predict what happens to one variable based on the knowledge you have of the other variable.
If your correlation coefficient is a negative number you can tell, just by looking at it, that there is an indirect, negative relationship between the two variables. As you may recall, a negative relationship means that as values on one variable increase (go up) the values on the other variable tend to decrease (go down) in a predictable manner. If your correlation coefficient is a positive number, then you know that you have a direct, positive relationship. This means that as one variable increases (or decreases) the values of the other variable tend to go in the same direction. If one increases, so does the other. If one decreases, so does the other in a predictable manner.
Correlation Coefficients Always Fall Between -1.00 and +1.00:
A correlation coefficient of -1.00 tells you that there is a perfect negative relationship between the two variables. This means that as values on one variable increase there is a perfectly predictable decrease in values on the other variable. In other words, as one variable goes up, the other goes in the opposite direction (it goes down). A correlation coefficient of +1.00 tells you that there is a perfect positive relationship between the two variables. This means that as values on one variable increase there is a perfectly predictable increase in values on the other variable. In other words, as one variable goes up so does the other. A correlation coefficient of 0.00 tells you that there is a zero correlation, or no relationship, between the two variables. In other words, as one variable changes (goes up or down) you can’t really say anything about what happens to the other variable.
Larger Correlation Coefficients Mean Stronger Relationships
Most correlation coefficients (assuming there really is a relationship between the two variables you are examining) tend to be somewhat lower than plus or minus 1.00 (meaning that they are not perfect relationships) but are somewhat above 0.00. Remember that a correlation coefficient of 0.00 means that there is no relationship between your two variables based on the data you are looking at. The closer a correlation coefficient is to 0.00, the weaker the elationship is and the less able you are to tell exactly what happens to one variable based on knowledge of the other variable. The closer a correlation coefficient approaches plus or minus 1.00 the stronger the relationship is and the more accurately you are able to predict what happens to one variable based on the knowledge you have of the other variable.
Making Statistical Inferences from Pearson’s r:
How do you determine whether or not a correlation is simply a chance occurrence or if it really is true of the population? There is a additional step you can do to determine the "significance" of your correlation coefficient. Just like other statistical tests, the significance of a correlation tests two hypotheses:
|
Null Hypothesis:
"There is not a significant correlation between the two variables; any observed trend or relationship may be due to chance and sampling error." For example:
|
Alternative Hypothesis:
"There is a significant correlation between the two variables; the observed trend or relationship is most likely not due to chance or sampling error." For example:
|
You will need three things in order to determine whether you can infer that the relationship you found in your sample is significant (in other words, “is generalizable” in the larger population):
The first thing you need to do is look down the degrees of freedom column until you see the row with the number of degrees of freedom that matches your sample degrees of freedom. Look across to the number listed under 0.05 level of significance. This number is called “the critical value of r”.
- The Correlation Coefficient that you calculated
- Something called the “degrees of freedom” which is simply the number of pairs of data in your sample minus 2.
- A table of “Critical Values” of the correlation coefficient.
The first thing you need to do is look down the degrees of freedom column until you see the row with the number of degrees of freedom that matches your sample degrees of freedom. Look across to the number listed under 0.05 level of significance. This number is called “the critical value of r”.
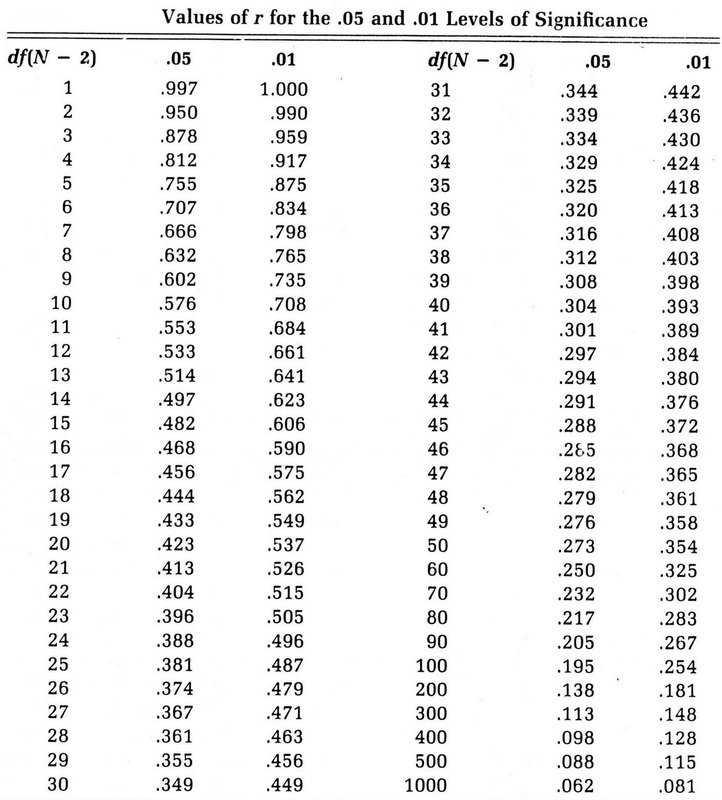
Draw your conclusion by comparing the calculated and critical r values:
- If the absolute value of the correlation coefficient you calculated is above the critical r value from the table, reject your null hypothesis and conclude that there is a statistically significant relationship between the variables.
- If the absolute value of the correlation coefficient you calculates is less than the number in the table, concluded that there is not a statistically significant relationship between your variables.
Calculating Correlation in Google Sheets
- In our class, the formula we'll want to use is =CORREL(A2:A1100,B2:B100). Replace A2:A100 with your data from the column and B2:B100 with your data from the second column.
- Calculating the Correlation in Google Sheets (website)
- Performing a Correlation in Google Sheets (video)
- Changing the number of digits displayed in your Google Sheet (website)
Using Excel to calculate the Correlation Coefficient
- Enter your data into two adjacent columns
- Click on the box in which you want the correlation coefficient to be placed
- Click the "Formulas" tab at the top of the screen
- Select the “Insert Function button”
- Search for "correlation" and then select the PEARSON option. Click OK.
- Select one data set column for ARRAY1 and the other data set column for ARRAY2. Click OK.
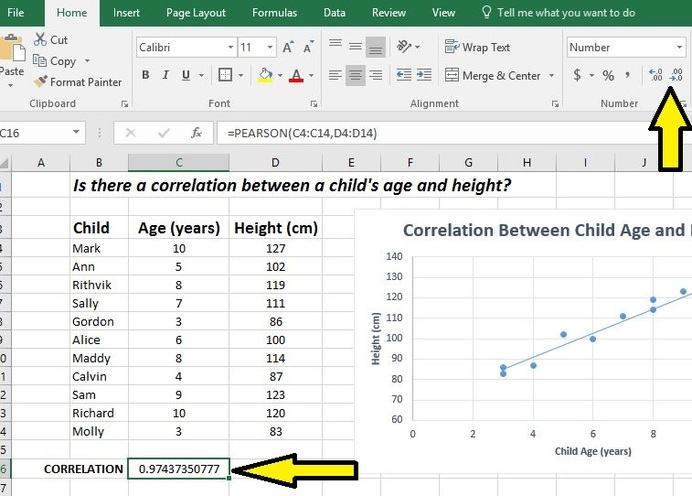
- Once you have the correlation coefficient, you need to make sure that you set the values to the correct number of digits. EXCEL will default to giving you too many numbers after the decimal place. Your correlation should have the same precision (number of digits after the decimal) as your data points. If your data is a whole number, the correlation should be rounded at the tenths place. To adjust the number of digits in Excel, click the box which is displaying the correlation coefficient and on the "Home" tab click the decrease decimal button until you have the correct number of digits showing.
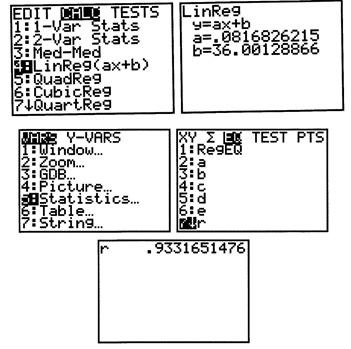
Performing a Correlation Coefficient test with the TI-83/84
|
|