BIOLOGY FOR LIFE
  • Syllabus
    • Core >
      • 1: Cell Biology >
        • 1.1: Introduction to Cells
        • 1.2: Ultrastructure of Cells
        • 1.3: Membrane Structure
        • 1.4: Membrane Transport
        • 1.5: The Origin of Cells
        • 1.6: Cell Division
      • 2: Molecular Biology >
        • 2.1: Molecules to Metabolism
        • 2.2: Water
        • 2.3: Carbohydrates and Lipids
        • 2.4: Proteins
        • 2.5: Enzymes
        • 2.6: DNA and RNA
        • 2.7: DNA Replication, Transcription and Translation
        • 2.8: Cell Respiration
        • 2.9: Photosynthesis
      • 3: Genetics >
        • 3.1: Genes
        • 3.2: Chromosomes
        • 3.3: Meiosis
        • 3.4: Inheritance
        • 3.5: Genetic Modification and Biotechnology
      • 4: Ecology >
        • 4.1: Species, Communities and Ecosystems
        • 4.2: Energy Flow
        • 4.3: Carbon Cycling
        • 4.4: Climate Change
      • 5: Evolution and Biodiversity >
        • 5.1: Evidence for Evolution
        • 5.2: Natural Selection
        • 5.3: Classification and Biodiversity
        • 5.4: Cladistics
      • 6: Human Physiology >
        • 6.1: Digestion and Absorption
        • 6.2: The Blood System
        • 6.3: Defense Against Infectious Disease
        • 6.4: Gas Exchange
        • 6.5: Neurons and Synapses
        • 6.6: Hormones, Homeostasis and Reproduction
    • Higher Level >
      • 7: Nucleic Acids >
        • 7.1: DNA Structure and Replication
        • 7.2: Transcription and Gene Expression
        • 7.3: Translation
      • 8: Metabolism, Cell Respiration & Photosynthesis >
        • 8.1: Metabolism
        • 8.2: Cell Respiration
        • 8.3: Photosynthesis
      • 9: Plant Biology >
        • 9.1: Transport in the Xylem of Plants
        • 9.2: Transport in the Phloem of Plants
        • 9.3: Growth in Plants
        • 9.4: Reproduction in Plants
      • 10: Genetics and Evolution >
        • 10.1: Meiosis
        • 10.2: Inheritance
        • 10.3: Gene Pools and Speciation
      • 11: Animal Physiology >
        • 11.1: Antibody Production and Vaccination
        • 11.2: Movement
        • 11.3: Kidney and Osmoregulation
        • 11.4: Sexual Reproduction
    • Options >
      • D: Human Physiology >
        • D.1: Human Nutrition
        • D.2: Digestion
        • D.3: Functions of the Liver
        • D.4: The Heart
        • D.5: Hormones and Metabolism
        • D.6: Transport of Respiratory Gases
  • IB Requirements
    • Learner Profile
    • Group 4 Project
    • External Exam
    • Internal Assessment >
      • Personal Engagement
      • Exploration
      • Analysis
      • Evaluation
      • Communication
    • Extended Essay
  • Investigation Skills
    • Lab Safety
    • Microscopy
    • Lab Drawings
    • Data Tables
    • Measurement
    • Statistics >
      • Descriptive Statistics >
        • Skew
        • Measures of Central Tendancy
        • Measures of Spread
        • Pearson Correlation
      • Inferential Statistics >
        • T-Test
        • ANOVA
        • Kruskal-Wallis
        • X2 Test for Independence
        • X2 Goodness of Fit
    • Graphing >
      • Graphing with Excel
      • Interpreting Error Bars
    • Error Analysis
  • Course Info
    • Above & Beyond >
      • Biology Club
      • Pumpkin Carving
      • Scavenger Hunt
      • Science News
      • IB Bio Dance
      • Wood Duck Project
      • Invasive Crayfish Project
    • Assessment >
      • Class Grading IB Bio I
      • Class Grading IB Bio II
      • Daily Quizzes
      • Lab Practicals
    • Class Photos
    • Recommendations
    • Supplemental Reading
  • Contact
  • About
    • Philosophy
    • Resume
    • Reflection
    • Site Feedback
    • Favorite Quotes
    • AEF Blog
  • Expeditions
    • Bahamas (2009)
    • Trinidad (2010)
    • Trinidad (2011)
    • Ecuador (2012)
    • Trinidad (2013)
    • Peru (2014)
    • Bahamas (2015)
    • Peru (2016)
    • Costa Rica (2017)
    • Costa Rica (2018)
    • Arizona (2022)
    • Florida (2023)
  • Summer Ecology Research

Independent T-test

The Student’s t-test is a statistical test that compares the mean and standard deviation of two samples to see if there is a significant difference between them.  In an experiment, a t-test might be used to calculate whether or not differences seen between the control and each experimental group are a factor of the manipulated variable or simply the result of chance.
Picture
The unpaired T-test would be used to determine if there is a significant difference between the control and treated enzyme activities.
Picture
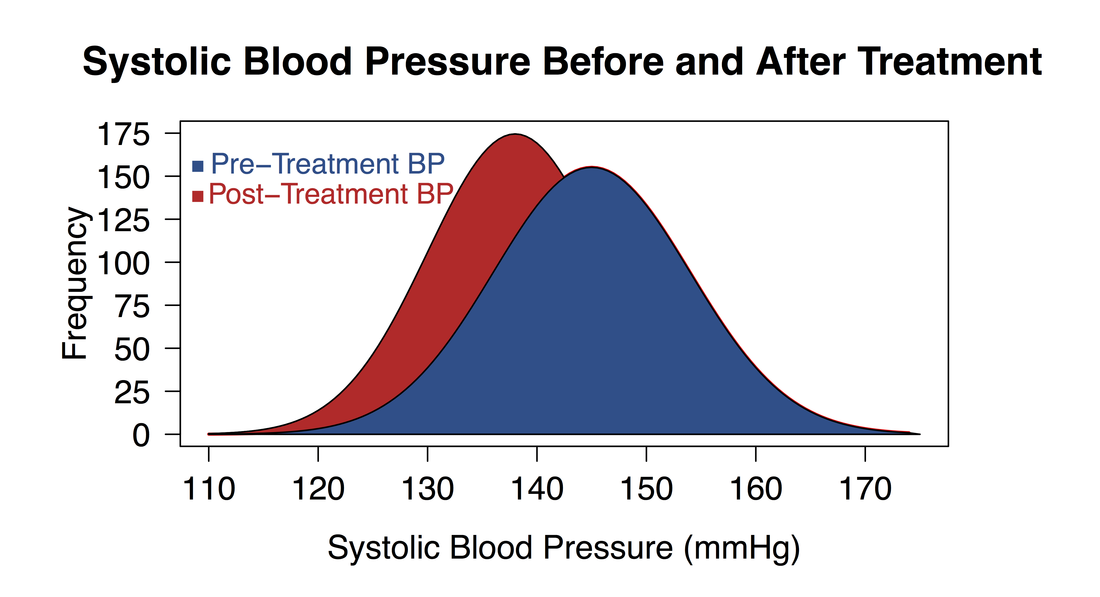
The paired T-test would be used to determine if there is a significant difference between the pre- and post-treatment blood pressures.
The T-test is a test of a  statistical significant difference between two groups.  A "significant difference" means that the results that are seen are most likely not due to chance or sampling error.  In any experiment or observation that involves sampling from a population, there is always the possibility that an observed effect would have occurred due to sampling error alone.  But if result is "significant,"  then the investigator may conclude that the observed effect actually reflects the characteristics of the population rather than just sampling error or chance.  

In any significance test, there are two possible hypothesis:
Null Hypothesis:
"There is not a significant difference between the two groups; any observed differences may be due to chance and sampling error."

For example:  
  • There is no significant difference between the control and treatment group enzyme activity; the difference we see in the means of the two groups may be due to chance and sampling error.
  • There is no significant difference between the blood pressure before and after treatment; the difference we see in the means of the two groups may be due to chance and sampling error.
Alternative Hypothesis:
"There is a significant difference between the two groups; the observed differences are most likely not due to chance or sampling error."

For example:  
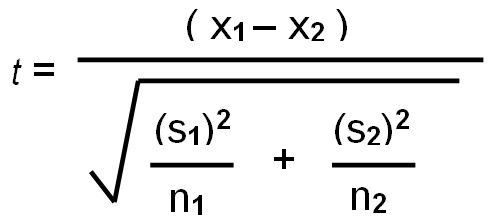
  • There is a significant difference between the control and treatment group enzyme activity; the difference seen in the means of the two groups is mostly likely not due to chance or sampling error.
  • There is a significant difference between the blood pressure before and after treatment; the difference we see in the means of the two groups is mostly likely not due to chance or sampling error.
Picture
Where:    
  • x1 is the mean of sample 1           
  • s1 is the standard deviation of sample 1             
  • n1 is the sample size of sample 1                
  • x2 is the mean of sample 2                
  • s2 is the standard deviation of sample 2                
  • n2 is the sample size in sample 2

How to Calculate T:  

The test statistic that a T-test produces is a T-value. The t-value represents how many standard units the means of the two groups are apart.  The larger the t-value, the more likely the two samples are significantly different from each other. 
  • Paired
  • Unpaired (select 2-tailed)

​If you want to calculate your own t-value, follow these steps:

  1. Calculate the mean (X) of each sample
  2. Find the absolute value  of the difference between the means 
  3. Calculate the standard deviation for each sample
  4. Square the standard deviation for each sample
  5. Divide each squared standard deviations by the sample size of that group. 
  6. Add these two values
  7. Take the square root of the number to find the "standard error of the difference.
  8. Divide the difference in the means (step 2) by  the standard error of the difference (step 7).  The answer is your "calculated T-value." 
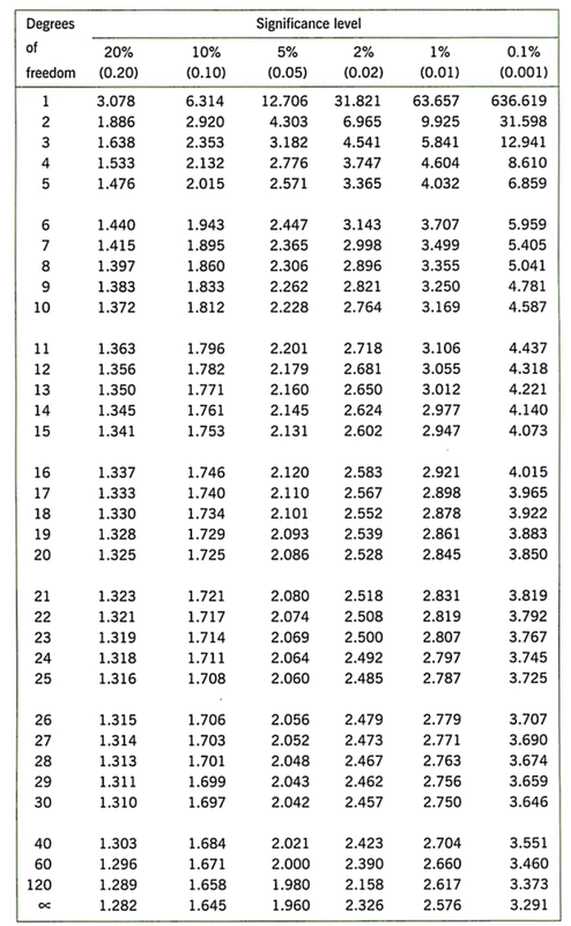
  9. Determine the degrees of freedom (df) for the test. In the t-test, the degrees of freedom is the sum of the sample sizes of both groups minus 2. 
  10. Determine the “Critical T-value” in a table by triangulating your DF and the “p value” of 0.05.  
A p-value s the probability of concluding there is a significant difference between the groups result when the null hypothesis is true (meaning, the probability of making the WRONG conclusion).  In biology, we use a standard “p-value” of 0.05. This means that five times out of a hundred you would find a statistically significant difference between the means even if there was none.  ​​
Picture
11.  Draw your conclusion:  
​
  • If your calculated t value is greater than the critical T-value from the table, you can conclude that the difference between the means for the two groups is significantly different.  We reject the null hypothesis and conclude that the alternative hypothesis is correct.

  • If your calculated t value is lower than the critical T-value from the table, you can conclude that the difference between the means for the two groups is NOT significantly different.  We accept the null hypothesis.

Sometimes it is nice to check your answers to make sure you are doing the calculations right.  Use this website to check your results.

Performing  a T-test with the TI-83/84 

Picture
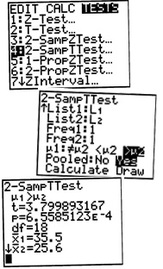
  1. Hit the STAT button on the calculator 
  2.  Select option 4 to clear any past lists of data. 
  3.  Select option 1 to EDIT your lists. 
  4. Enter your data for each group as List 1 and List 2 
  5. Hit STAT button and use the arrow key to move over to the TESTS option
  6.  Scroll down to option 4, the 2-sample T test and hit ENTER
  7. Scroll to the bottom of the screen and hit ENTER over the CALCULATE option 
  8. Your results are given. 

Performing a T-test in Google Sheets

  • In our class, the formula we'll want to  use is =TTEST(A1:A4, B1:B4, 2, 3).  Replace A1:A4 with your data from the first sample and B1:B4 with your data from the second sample.
  • Calculating the Standard Deviation in Google Sheets (website)
  • Performing a T-test in Google Sheets (video)
  • Changing the number of digits displayed in your Google Sheet (website)

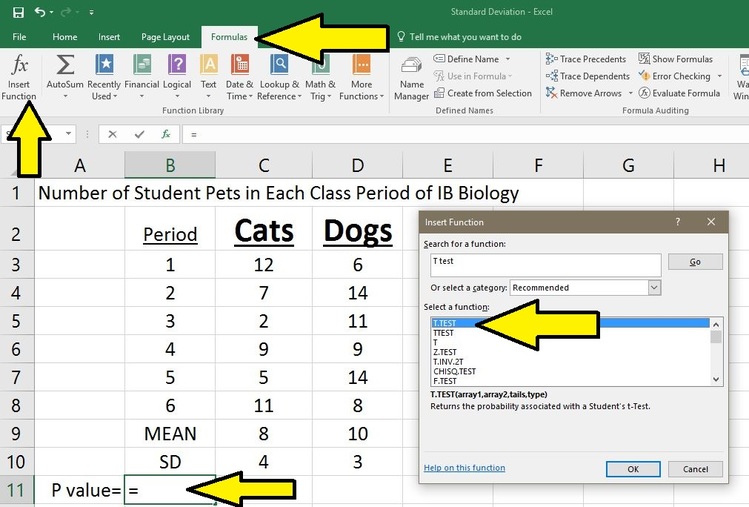
Performing a t-test with Excel 

Excel calculates a T-test in a slightly different way.  Rather than giving you the t value and comparing it to a table, Excel simply tells you the probability that the means are different simply due to chance, the “P value.”  Follow these steps to calculate a P value using a t-test with Excel:
  1. Create two columns, side by side, for the data of interest.  Each sample’s data should be in separate columns 
  2. Click on another blank cell where you wish the P value to appear. 
  3. Then click “fx” on the Excel Formulas toolbar.  
  4. In the box, search for the "T test" function and choose “T.TEST" from the list.  Hit OK.  You will need to set the t-test parameters:
Picture
  • For “Array1” highlight the data from one sample; for “Array2”, highlight the data in the second sample. 
  • Enter “2” in the box for “Tails.”
  • Lastly, you will have to select the “Type” of t-test.  For our purposes, we will mostly use type “2.”  Although, if you are measuring the same sample at two points in time (for example before and after treatment) then you would have a type "1." 

5.  After answering these questions click “OK” and the P value will appear.  The P value will fall between zero and one.
Picture

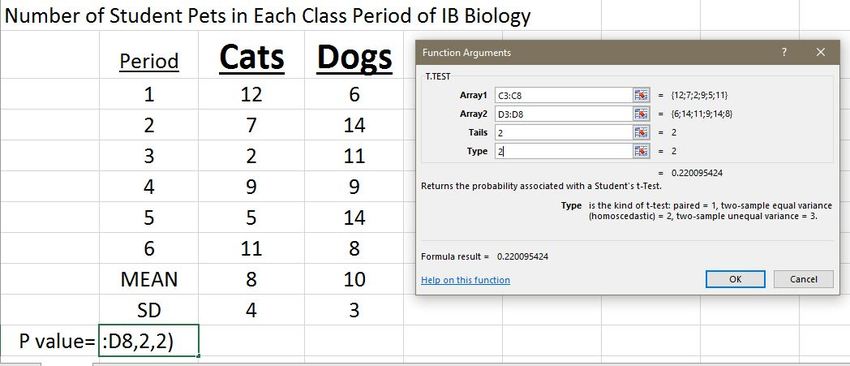
What does my P value mean?  Excel gives the chance that the differences between the two samples are due to random chance alone.  If Excel calculates a P value of 0.22, it means that there is a 22% likelihood that the difference in the means of your two data sets is due to random chance.  Normally will say that a P value of .05 or less is significant in which case we reject the null hypothesis (accept the alternative hypothesis).  If the P value is greater than 0.05, we accept the null hypothesis and conclude that there is no significant difference between the two groups.
I give many of my IB Biology resources away, for the benefit of students and teachers around the world. 
If you've found the materials helpful, please consider making a contribution of any amount
to 
this Earthwatch Expedition Fund. 

​Did I forget something?  Know of a mistake? Have a suggestion?  Let me know by emailing me here.

Before using any of the files available on this site,
​please familiarize yourself with the 
Creative Commons Attribution License. 
​​​It prohibits the use of any material on this site for commercial  purposes of any kind.  ​


"When we try to pick out anything by itself, we find it hitched to everything else in the Universe." 
 John Muir,   1911
  • Syllabus
    • Core >
      • 1: Cell Biology >
        • 1.1: Introduction to Cells
        • 1.2: Ultrastructure of Cells
        • 1.3: Membrane Structure
        • 1.4: Membrane Transport
        • 1.5: The Origin of Cells
        • 1.6: Cell Division
      • 2: Molecular Biology >
        • 2.1: Molecules to Metabolism
        • 2.2: Water
        • 2.3: Carbohydrates and Lipids
        • 2.4: Proteins
        • 2.5: Enzymes
        • 2.6: DNA and RNA
        • 2.7: DNA Replication, Transcription and Translation
        • 2.8: Cell Respiration
        • 2.9: Photosynthesis
      • 3: Genetics >
        • 3.1: Genes
        • 3.2: Chromosomes
        • 3.3: Meiosis
        • 3.4: Inheritance
        • 3.5: Genetic Modification and Biotechnology
      • 4: Ecology >
        • 4.1: Species, Communities and Ecosystems
        • 4.2: Energy Flow
        • 4.3: Carbon Cycling
        • 4.4: Climate Change
      • 5: Evolution and Biodiversity >
        • 5.1: Evidence for Evolution
        • 5.2: Natural Selection
        • 5.3: Classification and Biodiversity
        • 5.4: Cladistics
      • 6: Human Physiology >
        • 6.1: Digestion and Absorption
        • 6.2: The Blood System
        • 6.3: Defense Against Infectious Disease
        • 6.4: Gas Exchange
        • 6.5: Neurons and Synapses
        • 6.6: Hormones, Homeostasis and Reproduction
    • Higher Level >
      • 7: Nucleic Acids >
        • 7.1: DNA Structure and Replication
        • 7.2: Transcription and Gene Expression
        • 7.3: Translation
      • 8: Metabolism, Cell Respiration & Photosynthesis >
        • 8.1: Metabolism
        • 8.2: Cell Respiration
        • 8.3: Photosynthesis
      • 9: Plant Biology >
        • 9.1: Transport in the Xylem of Plants
        • 9.2: Transport in the Phloem of Plants
        • 9.3: Growth in Plants
        • 9.4: Reproduction in Plants
      • 10: Genetics and Evolution >
        • 10.1: Meiosis
        • 10.2: Inheritance
        • 10.3: Gene Pools and Speciation
      • 11: Animal Physiology >
        • 11.1: Antibody Production and Vaccination
        • 11.2: Movement
        • 11.3: Kidney and Osmoregulation
        • 11.4: Sexual Reproduction
    • Options >
      • D: Human Physiology >
        • D.1: Human Nutrition
        • D.2: Digestion
        • D.3: Functions of the Liver
        • D.4: The Heart
        • D.5: Hormones and Metabolism
        • D.6: Transport of Respiratory Gases
  • IB Requirements
    • Learner Profile
    • Group 4 Project
    • External Exam
    • Internal Assessment >
      • Personal Engagement
      • Exploration
      • Analysis
      • Evaluation
      • Communication
    • Extended Essay
  • Investigation Skills
    • Lab Safety
    • Microscopy
    • Lab Drawings
    • Data Tables
    • Measurement
    • Statistics >
      • Descriptive Statistics >
        • Skew
        • Measures of Central Tendancy
        • Measures of Spread
        • Pearson Correlation
      • Inferential Statistics >
        • T-Test
        • ANOVA
        • Kruskal-Wallis
        • X2 Test for Independence
        • X2 Goodness of Fit
    • Graphing >
      • Graphing with Excel
      • Interpreting Error Bars
    • Error Analysis
  • Course Info
    • Above & Beyond >
      • Biology Club
      • Pumpkin Carving
      • Scavenger Hunt
      • Science News
      • IB Bio Dance
      • Wood Duck Project
      • Invasive Crayfish Project
    • Assessment >
      • Class Grading IB Bio I
      • Class Grading IB Bio II
      • Daily Quizzes
      • Lab Practicals
    • Class Photos
    • Recommendations
    • Supplemental Reading
  • Contact
  • About
    • Philosophy
    • Resume
    • Reflection
    • Site Feedback
    • Favorite Quotes
    • AEF Blog
  • Expeditions
    • Bahamas (2009)
    • Trinidad (2010)
    • Trinidad (2011)
    • Ecuador (2012)
    • Trinidad (2013)
    • Peru (2014)
    • Bahamas (2015)
    • Peru (2016)
    • Costa Rica (2017)
    • Costa Rica (2018)
    • Arizona (2022)
    • Florida (2023)
  • Summer Ecology Research