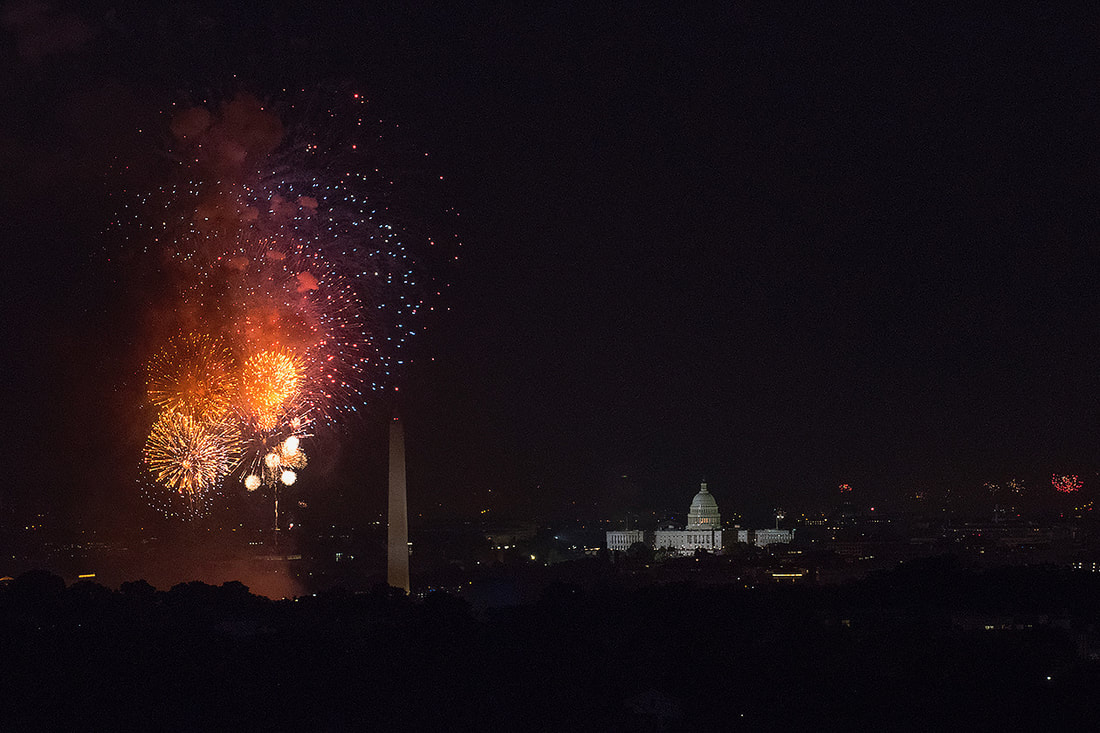
 My husband Curtis captured this 4th of July moment from our deck! My fellowship year is winding down and I am finally making time to write about some of the things I’ve done earlier in the year that have been on my “to blog” list but I haven’t gotten around to yet. Mostly I just want to document my experiences because I know that in hindsight this year as an Einstein fellow will feel like a blur. The recent 4th of July firework spectacular reminded me of another display of holiday lights, Christmas! Way back in December I joined with the two NASA fellows to attend a lecture by Dr. Miguel Roman, a research physical scientist and remote sensing specialist in the Terrestrial Information Systems Laboratory at NASA Goddard Space Flight Center. Dr. Roman’s session was about how NASA scientists are able to use satellite data to remotely sensor the Earth. Satellites provide a unique vantage point of space from planet Earth and enable us to track changes in and interrelatedness between the land, ocean, atmosphere and ice of our planet. 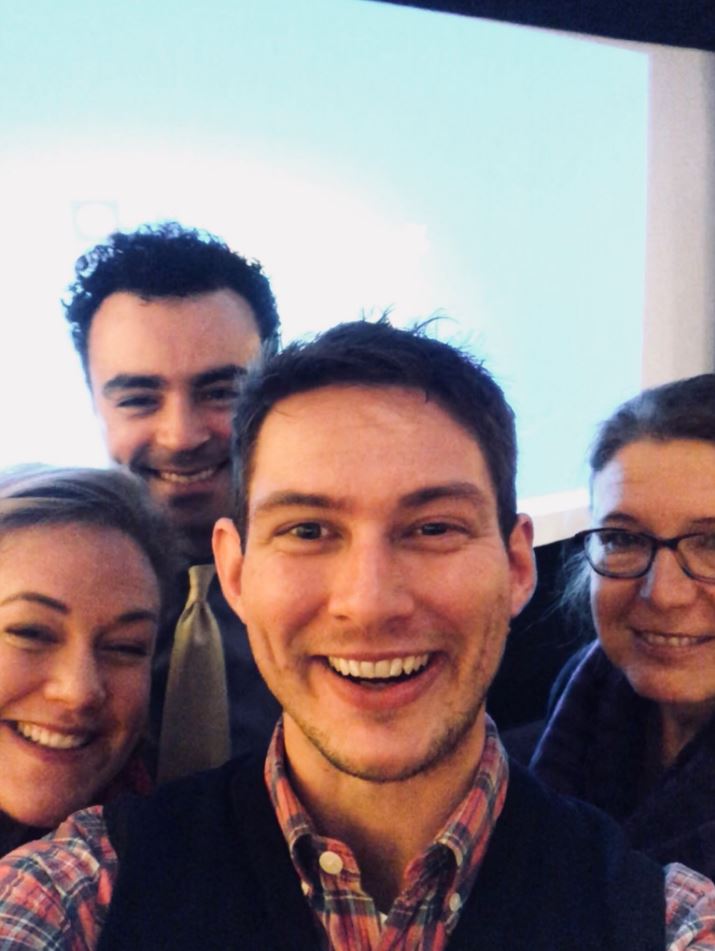 Three Einstein Fellows and one NASA scientist! Dr. Roman is a Earth scientist who is on the team that created the famous “Black Marble” images of our planet at night. From 500 miles out in space, the NOAA/NASA Suomi National Polar Orbiting Partnership satellite uses a visible infrared imaging radiometer to observe the planet. Human societies run on energy and each night as we switch on the lights to help us function in the dark, patterns of light spread across the surface of Earth creating a spectacular visualization of our energy-use decisions. In fact, during major holidays, such as Christmas in the United States and the holy month of Ramadan in the Middle East, these lighting patterns change and can be seen from space!. 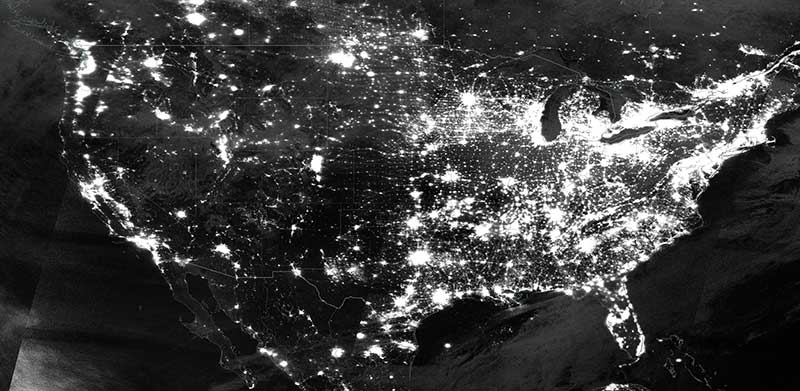 Image of night time lights over the US acquired on 29 January 2017 by the Day/Night Band of the Visible Infrared Imaging Suite (VIIRS) instrument, on board the joint NASA/NOAA Suomi National Polar-orbiting Partnership (Suomi-NPP) satellite. A component of NASA’s mission is to provide data and tools for others to use for societal development. The Earth at night images provides information relevant to “human centered earth-systems science research.” Energy use is dictated by the routines of the communities in which we live and the NASA satellites technologies allow us to observe shifts in energy use in time and space. For example, the images can be used for tracking migrations and demographic changes, monitoring disaster response, and verifying claims made by energy providers. The images are not easy to create! Each pixel of the image is about 3 X 3 city blocks and there are challenges in removing “light noise” captured by the satellites so that only human generated light is displayed. For example, light from the moon, reflections off snow, fires, lightening and aurora must be subtracted from the data prior to display. Additionally, there is the problem of vegetation blocking and scattering light. The final map of Earth at night that we see is actually a composite image collected from 5247 orbits of the satellite collecting 42 terabytes worth of raw data! Dr. Roman's session was really "lit" and I learned a lot that will "light up" my future instruction of Earth systems and human impact! 🔥 🔥 🔥
|
Archives
July 2018
|
I give many of my IB Biology resources away, for the benefit of students and teachers around the world.
If you've found the materials helpful, please consider making a contribution of any amount
to this Earthwatch Expedition Fund.
Did I forget something? Know of a mistake? Have a suggestion? Let me know by emailing me here.
Before using any of the files available on this site,
please familiarize yourself with the Creative Commons Attribution License.
It prohibits the use of any material on this site for commercial purposes of any kind.